
![]() THE FERTILITY INDUSTRY
THE FERTILITY INDUSTRY
At HealthCare Appraisers, we are observing a growing interest in the fertility market. Numerous factors, many of which are unique to this subsector of healthcare, are driving demand for fertility services to previously unseen levels. In this FMVantage Point™, we explore the socioeconomic factors which are driving transaction activity by private equity investors and fertility clinic platforms. Further, we analyze worldwide case studies that bolster the overall investment thesis of the industry. Finally, we discuss how market participants also need to consider the regulatory risks involved in such transactions, as failure to adhere to proper compliance standards may render an opportunity from boon to bust.
![]() OVERVIEW OF DEMAND
OVERVIEW OF DEMAND
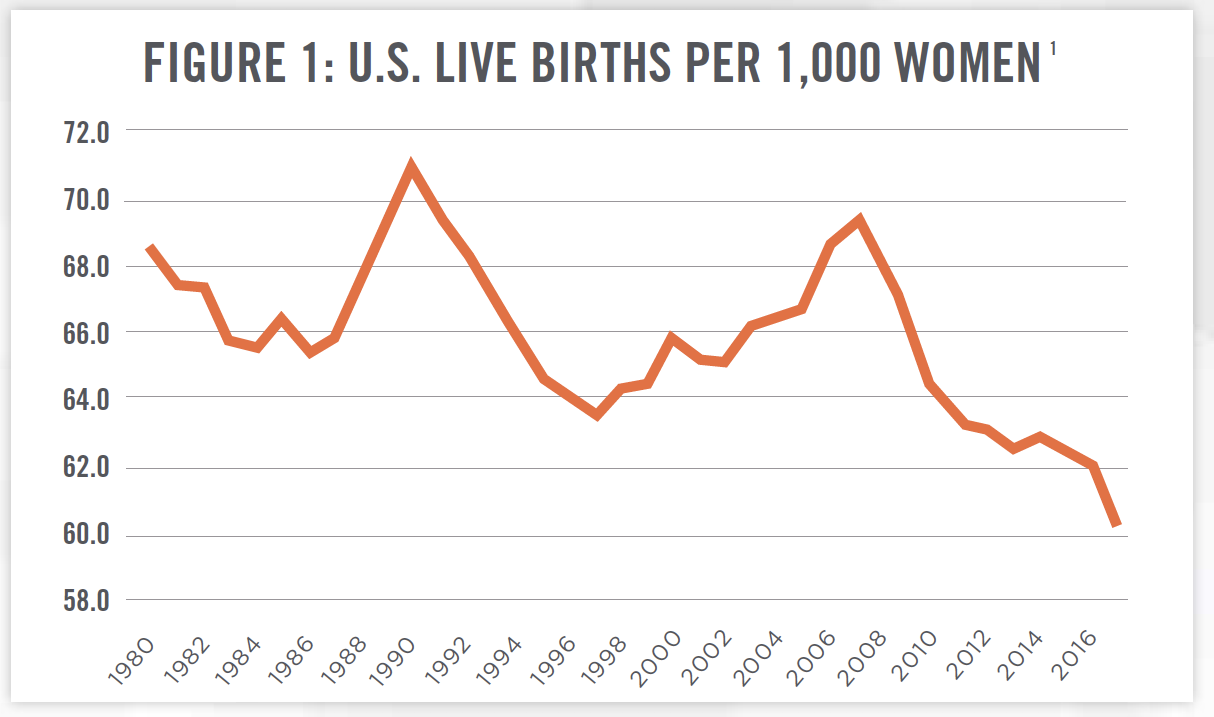
The modern fertility market, consisting of reproductive endocrinology practices and organizations devoted to addressing infertility issues, has existed since the 1970s, with the first baby conceived with in vitro fertilization (“IVF”), Louise Brown, born in 1978. We are observing a surge in both interest and activity within this market space. On the demand side, there is a perfect storm of financial, demographic, and social factors driving this recent trend. In developed countries, men and women are waiting longer to begin families, as a result of personal debt levels and other financial pressures of having children, as well as the prioritization of other life experiences above having a family during early adulthood. Figure 1 outlines the change in fertility rates in the United States since 1980. In 2017, the most recent data available, the CDC reported a record low of 60.3 births per 1,000 women aged 15 to 44. Women have been giving birth to fewer children over time as well. In 1976, 32 percent of households with children had one or two children, and 59 percent had three or more. By 2014, these percentages had reversed to 53 percent and 32 percent, respectively.[2] This trend is found in most other economically developed countries as well. A lower level of fertility, among other factors, is attributable to an increase in average age of couples trying to have children.[3]
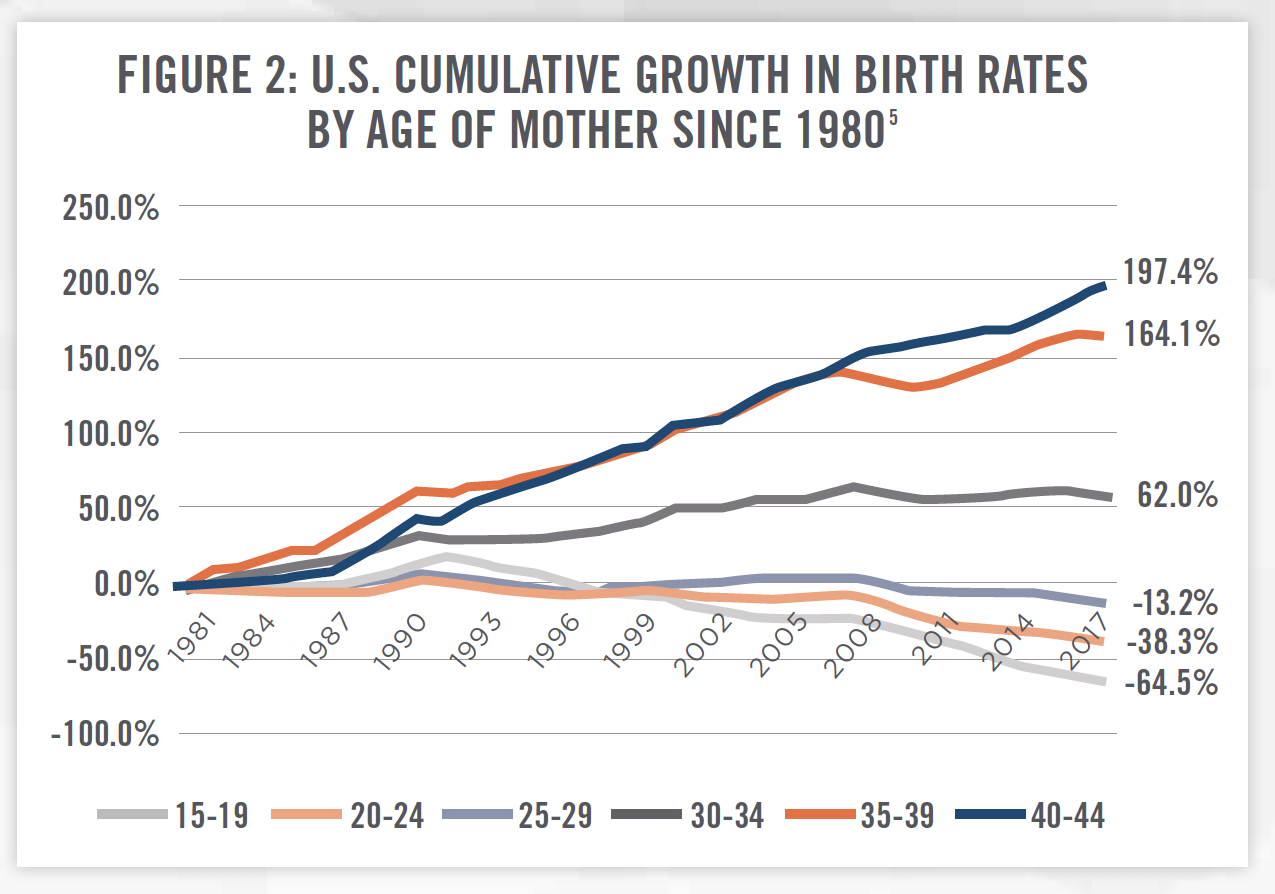
To quantify this demographic shift of increasing mother’s age at birth, Figure 2 examines the cumulative growth in birth rates by age of U.S. mothers. Birth rates for mothers aged 30 to 44 have significantly increased, while rates for mothers aged 15 to 29 have all decreased since 1980. This overall shift in the increasing age is inversely correlated with the fertility rate in the U.S. The causal connection is that older mothers tend to have decreased fertility.[4] Infertility issues affect 12 percent of U.S. families trying to conceive.[5] Should this trend continue, one could project the trend line in Figure 1 to continue downward in the future. While Figures 1 and 2 present data illustrating why fertility services are experiencing increased demand, increasing age at motherhood is certainly not the only reason. LGBTQ couples are also increasingly seeking services to assist in starting their own families. Additional demand comes from the desire to understand one’s personal genetics on an increasingly larger scale, whether to satisfy curiosity of their ancestry or to learn their risks of passing genetic defects onto offspring.
Historically, consumers seeking fertility services have been denied any sort of insurance benefits. These consumers resorted to high out-of-pocket payment amounts to receive services. HealthCare Appraisers has observed a waning of this tendency, as Progyny, Inc. (NASDAQ: PGNY), a fertility benefit manager, and traditional health insurers are increasingly offering fertility service benefits. Consumers are now better able to pay for these services than ever before. The decreasing (albeit slowly) costs of technology combined with the bargaining power of insurers are putting fertility services in reach for an ever-increasing demographic.
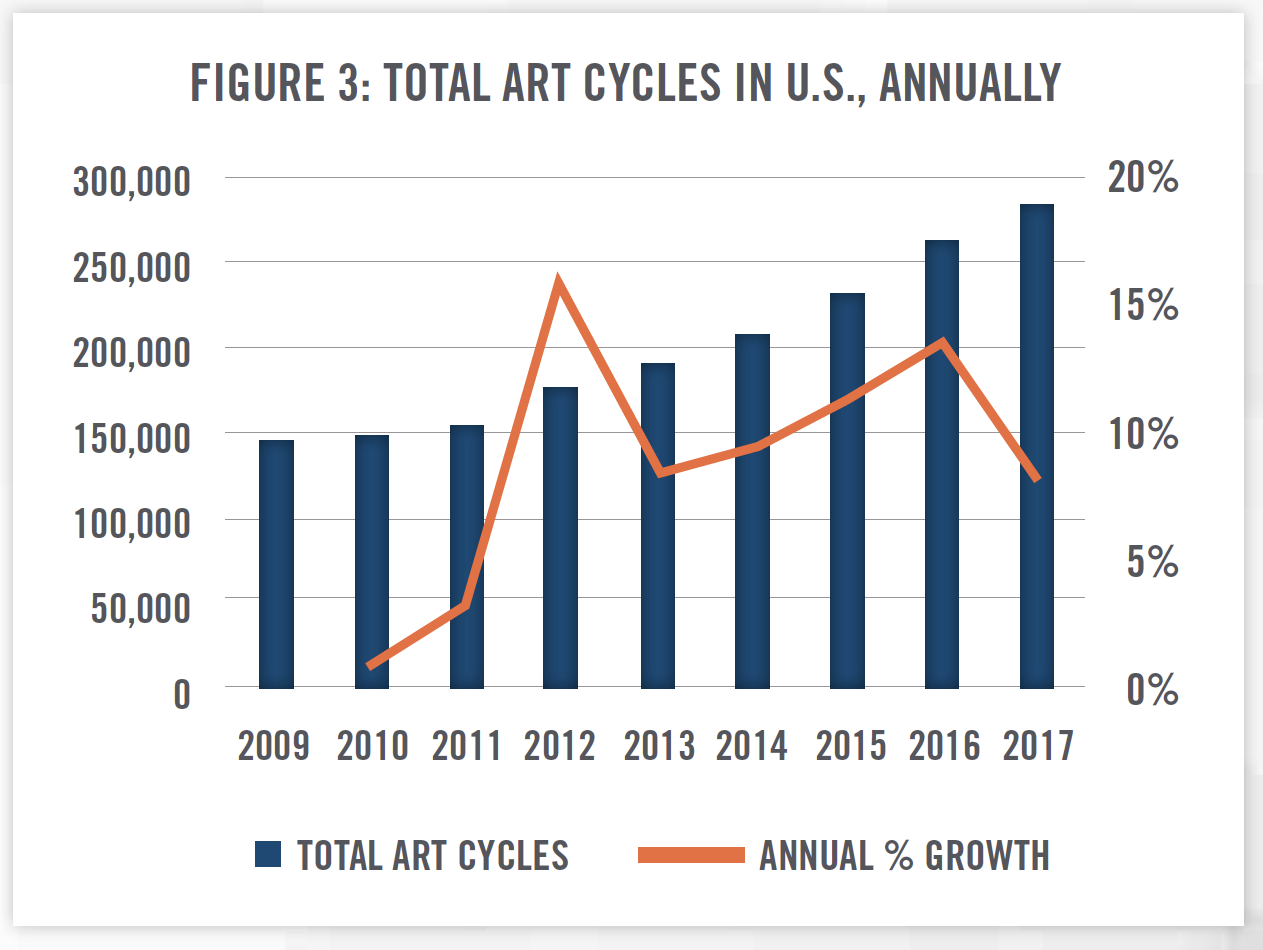
In face of these high historic costs, the Centers for Disease Control and Prevention (“CDC”) began issuing annual Assisted Reproductive Technology (“ART”) summary reports. In these reports, the CDC collects detailed treatment types, complications, and end results in order to publish success rates to help consumers evaluate fertility clinic performance. Figure 3 illustrates the number of total ART cycles performed in the US, according to these reports. From 2009 to 2017, ART cycles have increased by a compounded annual growth rate of 8.67 percent.
![]() OVERVIEW OF SUPPLY
OVERVIEW OF SUPPLY
Providers of fertility services have been responding to this increasing demand for fertility services—advancements and improvements in standard fertility procedures such as IVF have gradually become both more accepted, as well as financially more affordable. Once known as a high-cost, high-risk gamble, progress has increasingly made these options more affordable. Additionally, we are witnessing an advent of risk-sharing services among fertility service providers. That is, some clinics and practices are advertising policies to refund patients who end up not conceiving, by increasing the costs marginally across the full spectrum of services. The high cost of the services becomes much more palatable to consumers as the financial risk has decreased via this insurance-like mechanism.
Fertility services are not just limited to IVF-related services. Providers are giving parents to-be an ever-wider array of options, from donor services to surrogacy. Providers are also giving customers the ability to “lock-in” their fertility using cryopreservation of eggs, sperm, and embryos, allowing parents to better align their family goals with social and career goals.
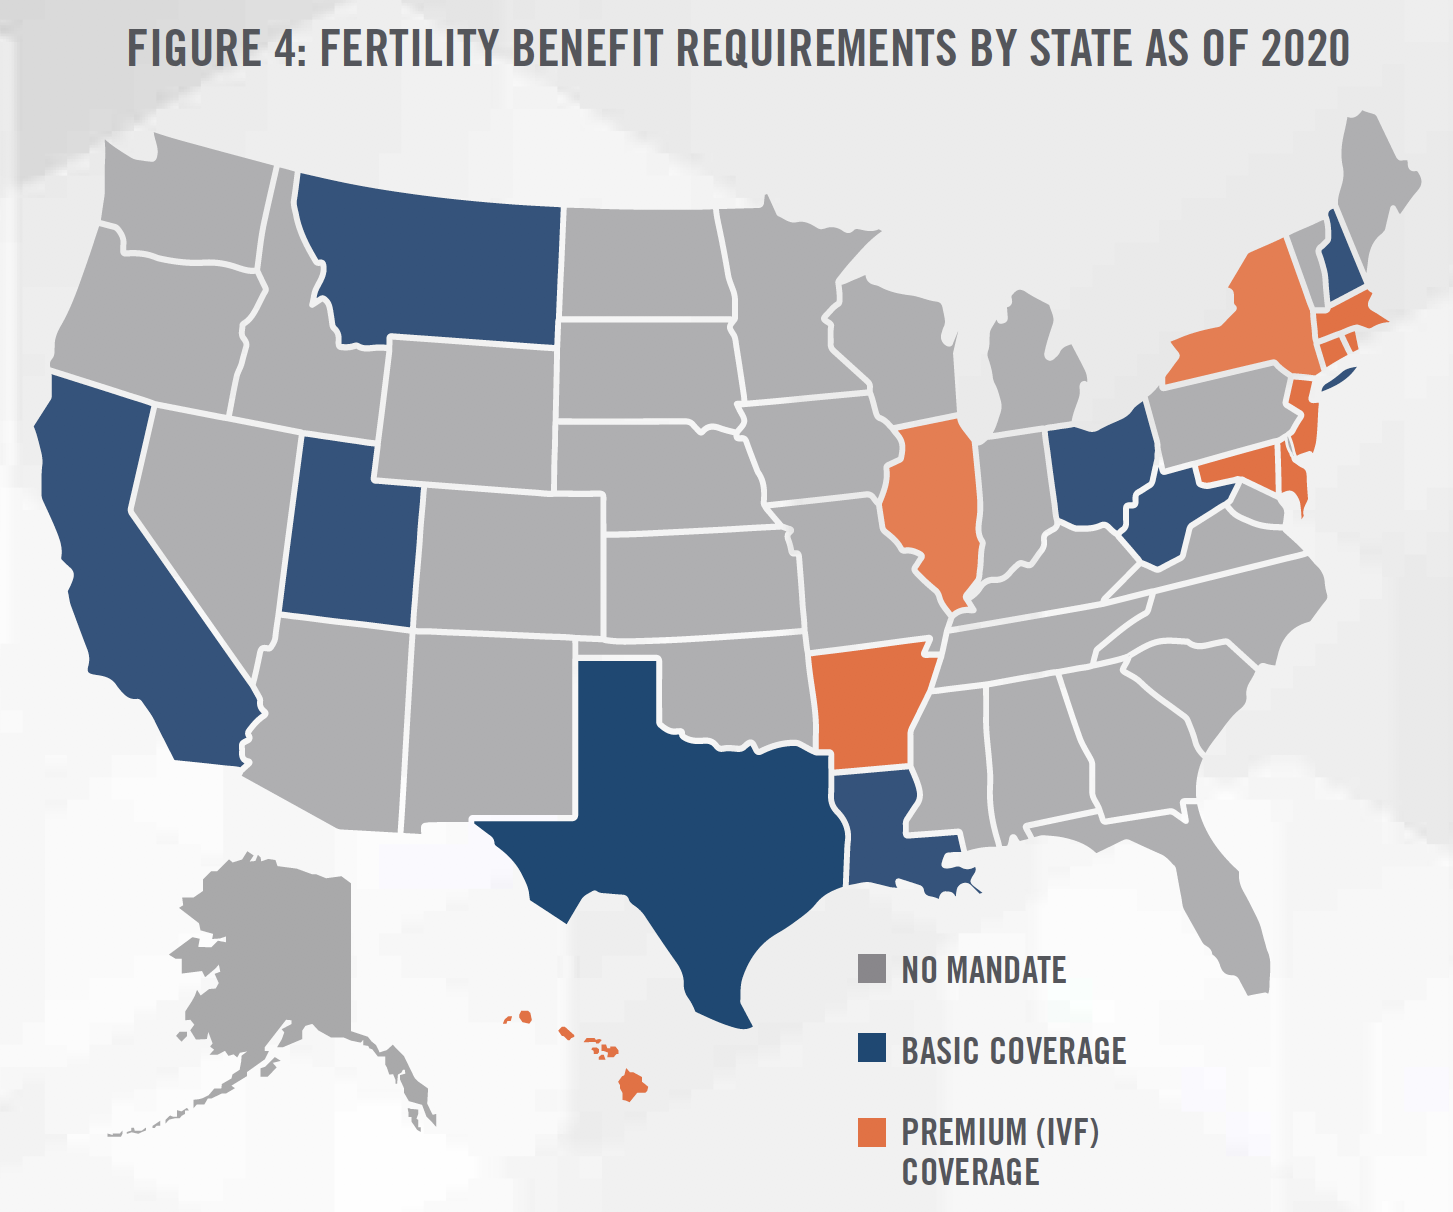
Employers are also increasingly offering fertility benefits to attract and retain top talent in their industries. Understanding that this talent is often choosing to delay family origination in order to advance careers, employers such as Facebook and Microsoft have turned to Progyny, which submitted its S-1 filing to the SEC on September 27, 2019, and went public on October 25, 2019. Additionally, traditional health insurers and providers such as Cigna, Humana, and Kaiser Permanente have started to offer some form of fertility benefits on a portion of their plans. Employers are recognizing that, regardless of the decision to cover such services, there is an implicit cost of suboptimal fertility. For example, problems related to infertility can lead to absenteeism at work. Some states are taking the lead on mandating some level of fertility benefits within their own borders. Figure 4 outlines: (i) states lacking mandates (gray); (ii) states either prohibiting exclusion of fertility benefits or mandating basic fertility benefits (blue); and (iii) states mandating fertility benefits, including the coverage of IVF services (orange).
As illustrated in Figure 3, demand for fertility services has grown at an impressive rate over the last decade. By contrast, the supply of fertility services, at least in the U.S., has experienced slow growth. The corresponding physician specialty, reproductive endocrinology, is a subspecialty of the better-known obstetrics/gynecology. A reproductive endocrinologist attends four years of medical school, four years of OB/GYN residency, followed by a three-year fellowship in an American Board of Obstetrics and Gynecology (“ABOG”) certified-program for reproductive endocrinology. After completing both written and oral exams, a physician can become a fully-certified reproductive endocrinologist. With all the rigorous, required training, it is uncommon to find such physicians under the age of 33. There are 43 ABOG-certified programs in the U.S., which graduate approximately 45 new reproductive endocrinologists each year. Roughly the same number retire from practice each year, causing the number of physicians to remain relatively even at 1,200 to 1,300, according to the American Society for Reproductive Medicine.[6]
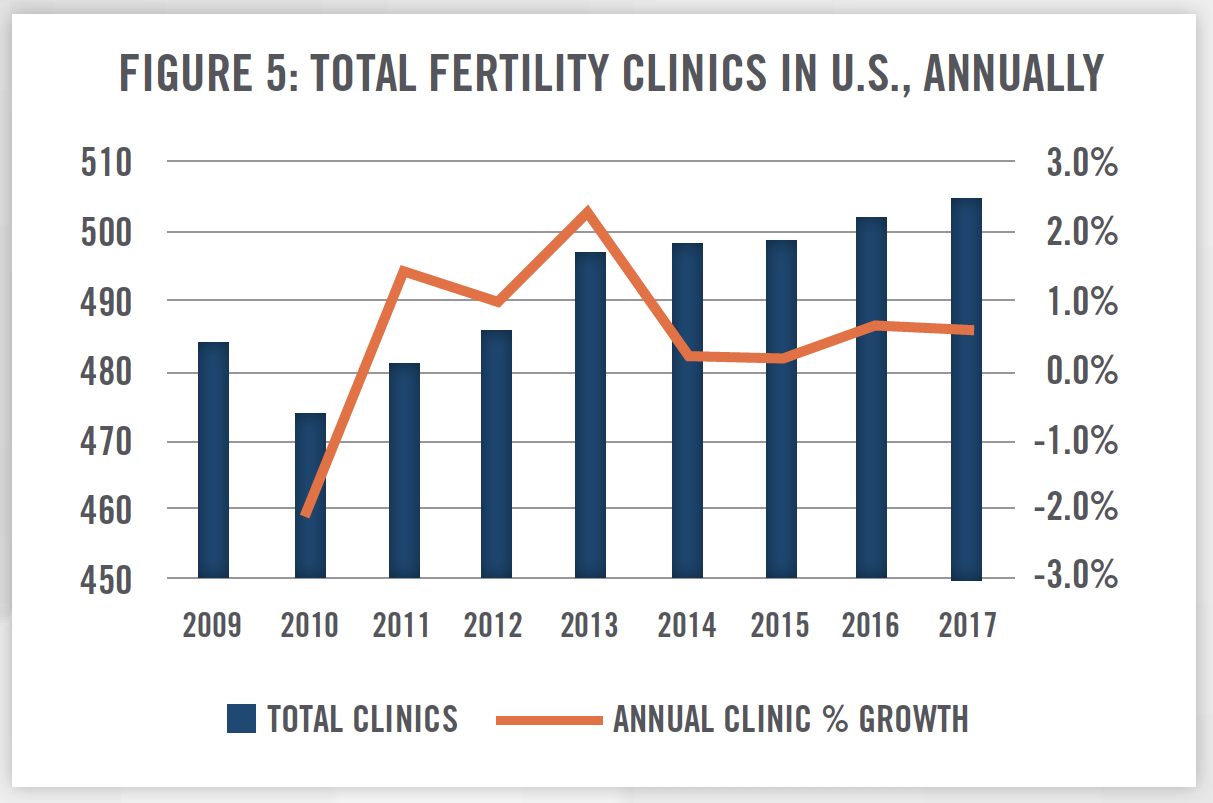
Just as the number of reproductive endocrinologists has remained relatively steady, we view a similar trend with the number of fertility clinics in operation each year. Figure 5 outlines the growth in fertility clinics since 2009, as measured by the CDC’s annual ART report. From 2009 to 2017 the number of fertility clinics has grown by no more than 2.26 percent in any given year.
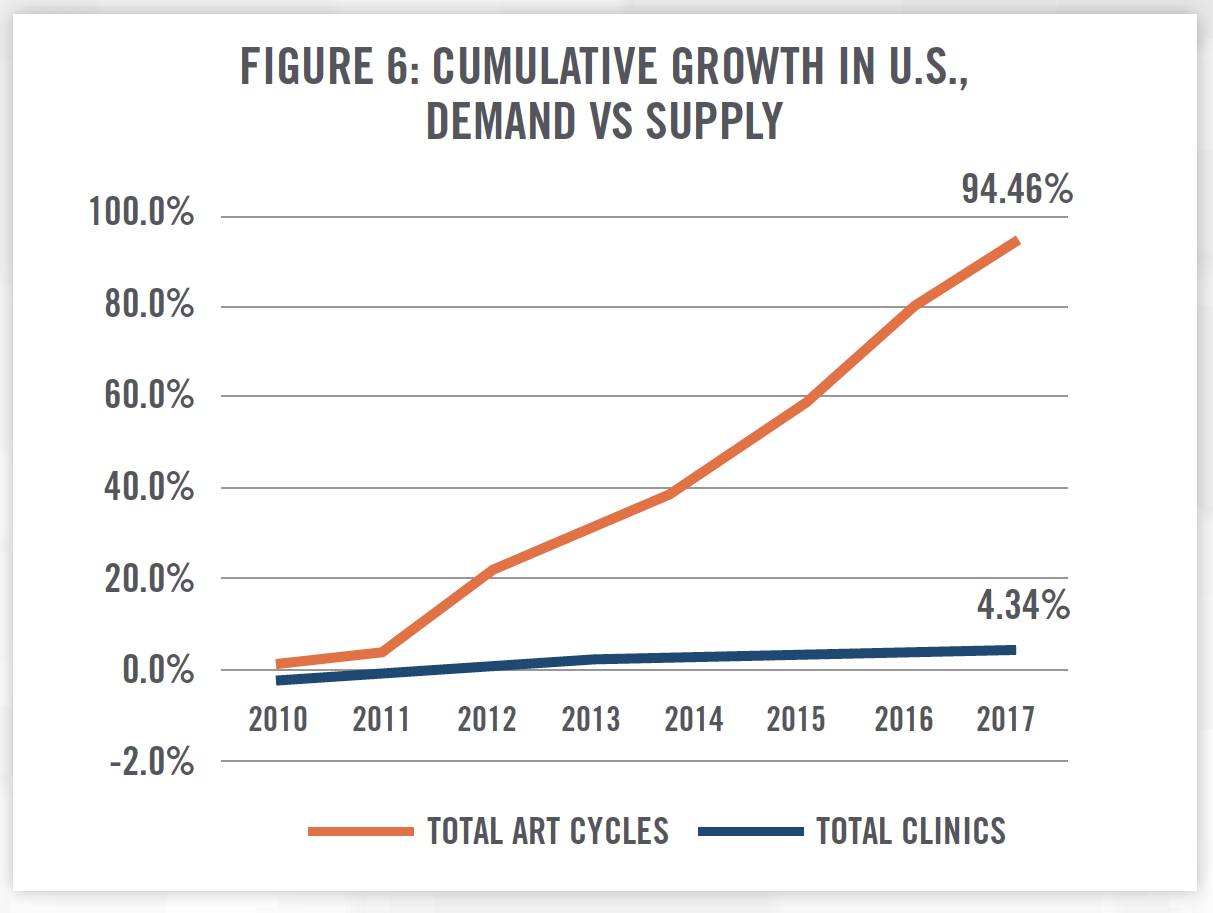
When viewing supply and demand for fertility services together, constrained supply has been forced to scale in order to meet demand. Figure 6 demonstrates the cumulative growth in ART cycles (i.e., demand) versus fertility clinics (i.e., supply), highlighting the disparity in supply and demand over these eight years. With limits on the ability to build-out new facilities and train new reproductive endocrinologists, demand is being handled by the existing supply of clinics scaling to meet demand.
![]() PRIVATE EQUITY ENTERS THE MARKET
PRIVATE EQUITY ENTERS THE MARKET
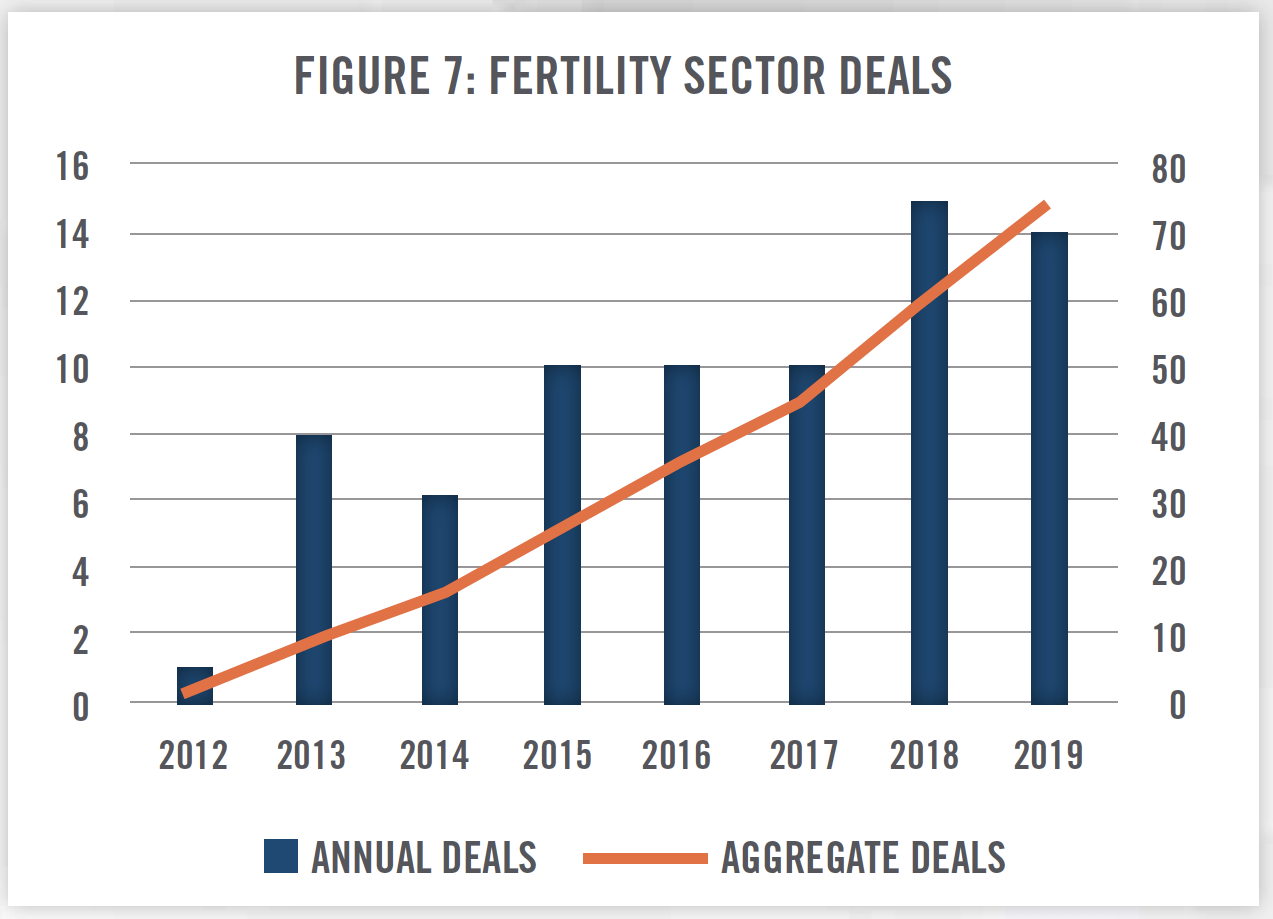
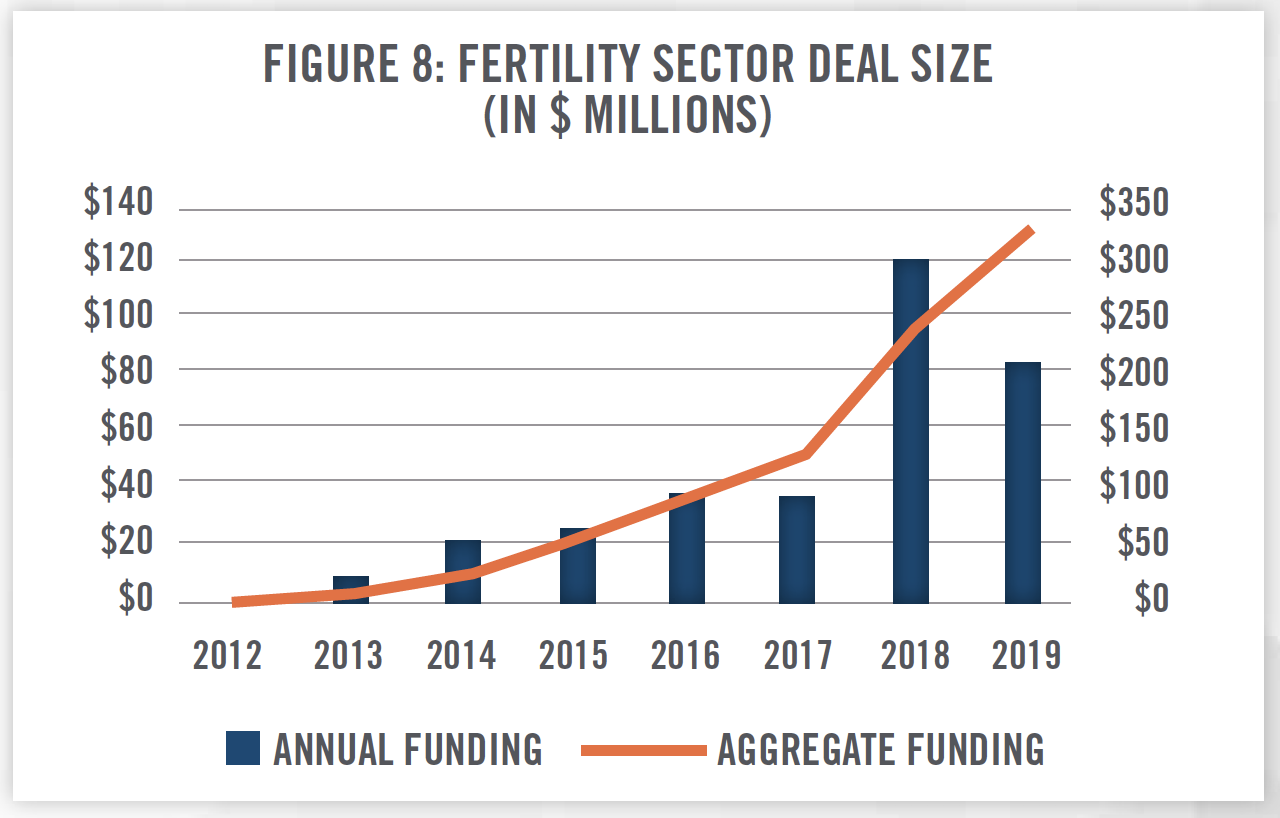
Private equity companies have taken notice of these positive trends and opportunities, and they are moving to capitalize on investment opportunities within the fertility market. Supply of clinics and reproductive endocrinologists have increased slowly, resulting in private equity firms needing to purchase interests in existing facilities as bolt-on acquisitions (as opposed to de novo investments) in order to invest in the fertility industry. We are witnessing a trend in both expansions and horizontal integration of fertility service providers, as large players like Shady Grove Fertility and Prelude are acquiring significant market share in an otherwise fragmented market. Historically, fertility clinics have operated as independent providers, as opposed to hospital or team-based care facilities. Figures 7 and 8 outline identified fertility-related transactions in the marketplace over the last eight years.[7]
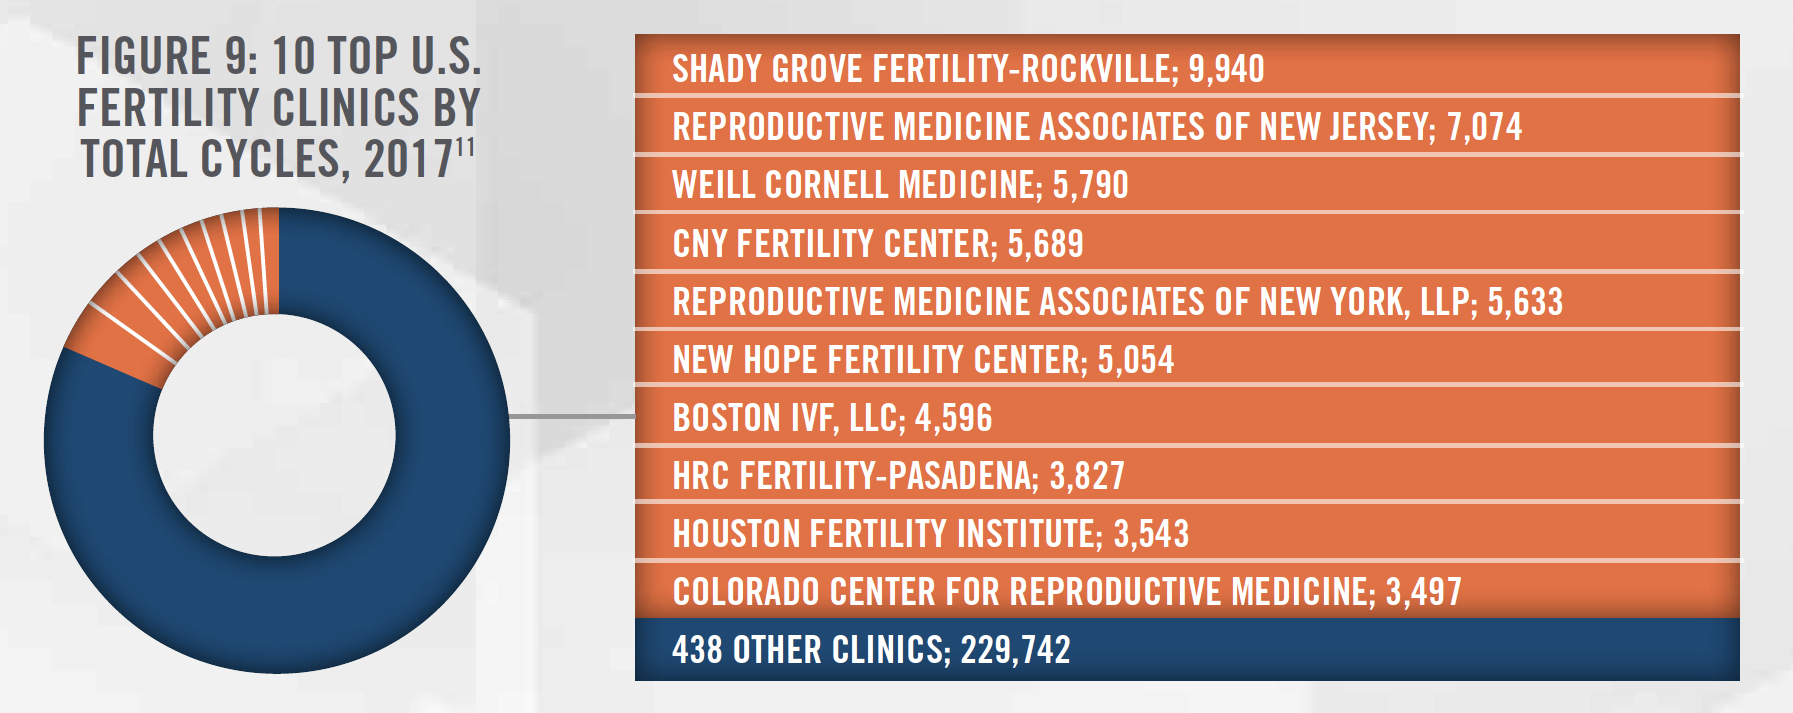
In addition to market transactions, private equity firms are also increasingly funding existing companies to pursue market growth. As of October 2019, Kindbody was the most recent recipient of significant private equity funding, receiving $22.47 million, totaling $39.47 million raised to date.[8] In June 2019, Modern Fertility received $15 million in funding, for a post-money valuation of $60 million. In 2017 alone, over 75 fertility-related firms received $178 million from private market investors. In 2017, Shady Grove Fertility, one of the largest platforms in the fertility market (see Figure 9), acquired Georgia Reproductive Specialists for an undisclosed amount. Though details can be scant, numerous fertility transactions have been consummated in recent years.
Mergers and acquisitions have increased in frequency. In the U.S., private equity firms have acquired stakes in fertility clinics, such as Sverica Capital Management’s announced stake in In Vitro Sciences in October 2019.[9] In Vitro Sciences, a partner/ operator of multiple fertility clinics, currently performs over 5,000 annual cycles. In Figure 9, a list of the top ten clinics in the U.S. by total cycle volume in 2016 gives context to how large a transaction this represents in the fertility industry. In May 2019, NMC Healthcare (LSX:NMC) disclosed a majority stake in Boston IVF, another top fertility clinic by volume. While terms of the deal were not disclosed in the Boston IVF deal, NMC also acquired a 51 percent majority stake of Fakih IVF Group, a major regional Middle East IVF provider for USD $189.55 million, representing an 11.15x EBITDA multiple. NMC acquired the remaining 49 percent in 2018 for $205 million, although EBITDA was not disclosed.[10] Increasing merger and acquisition activity certainly signals market interest in the fertility space.
As mentioned earlier in this article, the initial public offering of Progyny is another indicator of market interest in the fertility space. In its S-1 filing, Progyny reported $103.4 million in revenue and $4.04 million in net income for the first half of 2019. Approximately one in three states mandate some sort of coverage for infertility, a figure that Progyny expects to grow in the future. The American Medical Association recently recognized infertility as a disease in 2017. Based on employee counts for self-insured employers (Progyny’s target customer), there is an addressable market of approximately 70 million people. Progyny (NASDAQ: PGNY) began public trading on October 25, 2019. Although its initial public offering share price of $13 was below the expected range of $14 to $16, the shares closed at $15.94 per share, up 22.6 percent on the first day of trading. Nearly three months later, the stock closed at approximately $31 per share, for a gain of over 130 percent, indicating the significant, continued interest in the U.S. fertility industry. This company will provide valuable insight to the state of the U.S. fertility industry going forward.
![]() FERTILITY MARKETS ABROAD
FERTILITY MARKETS ABROAD
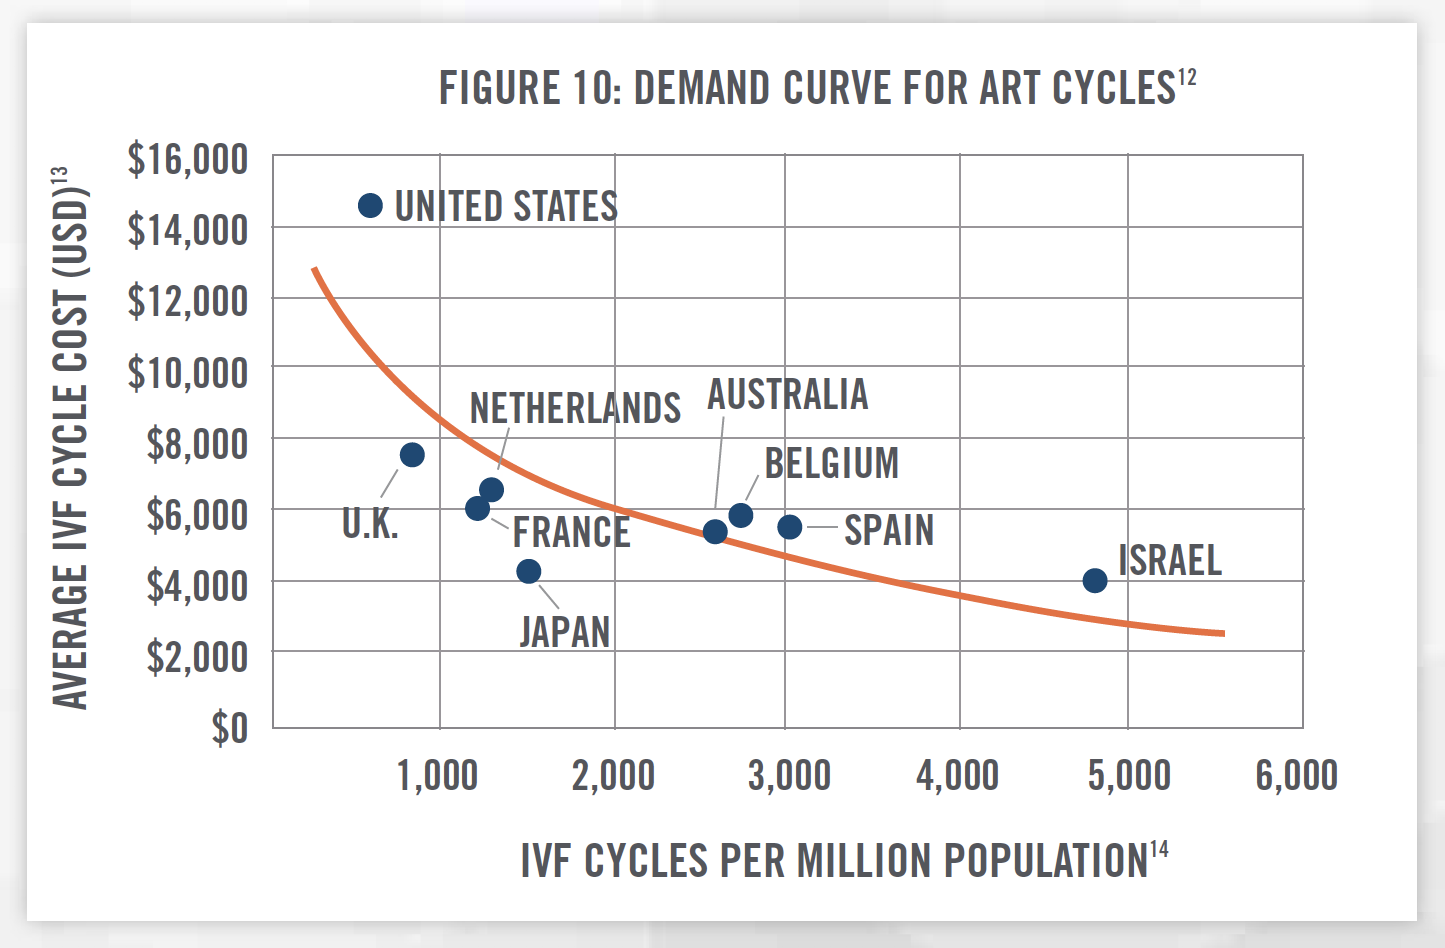
 While fertility services are technologically advanced in the U.S., the fertility industry as a market sector has been developing abroad both longer and faster than in the U.S. A significantly higher proportion of people utilize ART therapies internationally, while the costs of ART cycles are considerably less compared to the U.S. Figure 10 plots average costs[13] of a single IVF cycle against the number of IVF cycles per million population[14], based on 2016 data. As would be expected, we see that lower cost services are utilized by a higher proportion of the population. The U.S. is higher in cost than other countries; however, this so far has not prevented demand from surging as outlined in Figure 6. This could provide insight to those looking to forecast the U.S. fertility market—for example, if the US average IVF cycle price dropped to match Israel’s $4,000 from its current ~$15,000 (a decrease of approximately 75 percent), perhaps utilization would increase from present-day 800 cycles per million to 4,800 cycles per million. Total revenue could theoretically increase on a net basis, even if the list price for IVF cycles were to fall. This is an appealing fallback scenario for private equity investors.
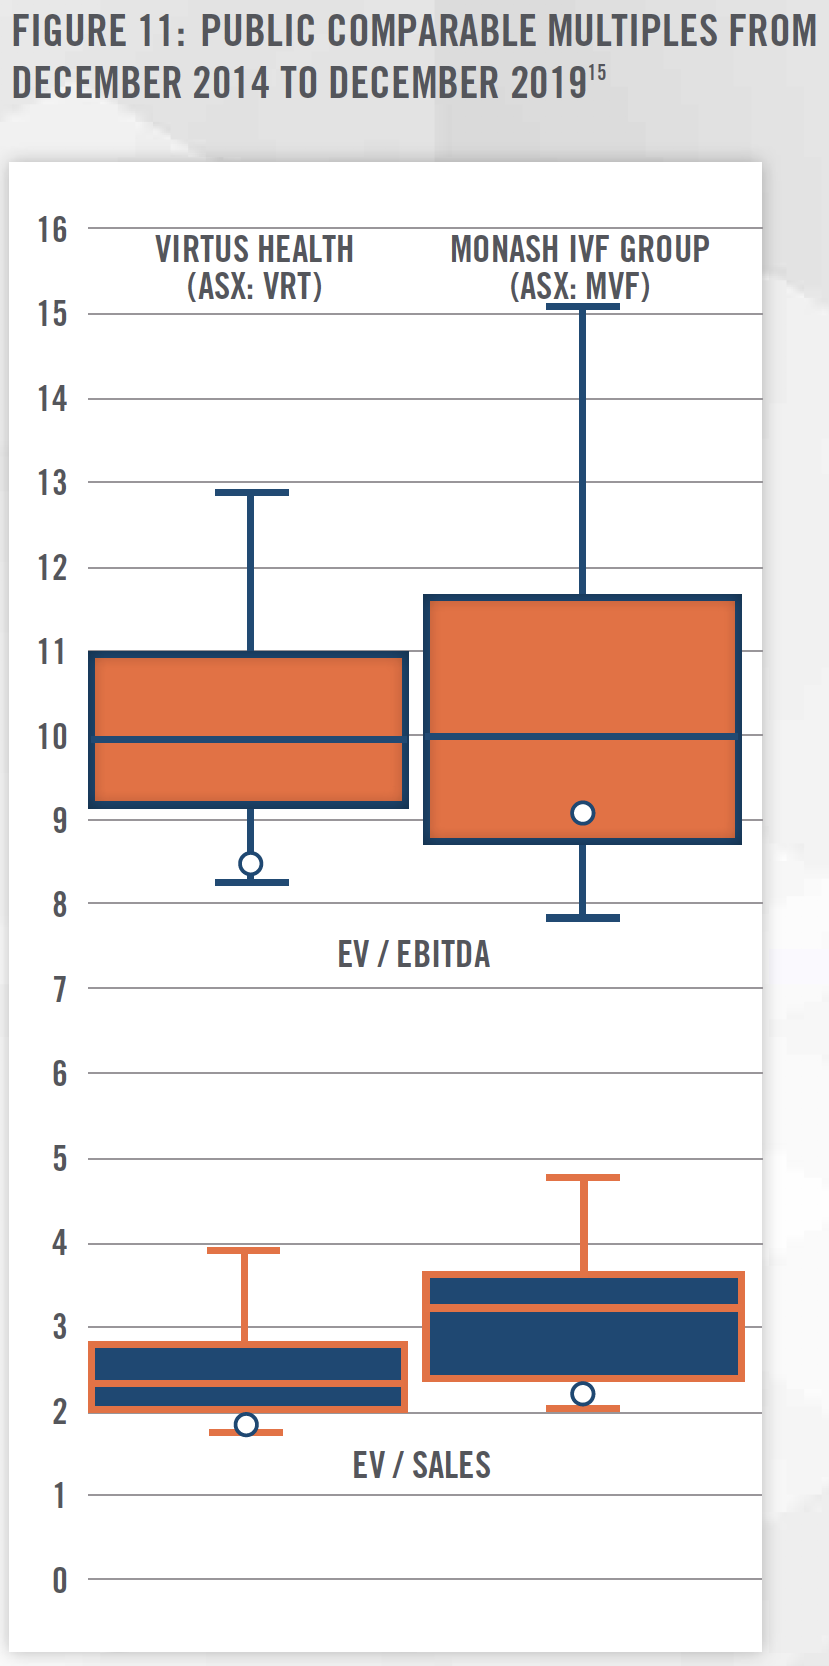
As Figure 10 outlines, the international markets can provide insight into the fertility industry. In a typical analysis, one might look to the U.S. public markets for information. There are no publicly traded pure-plays of fertility services in the U.S., but in Australia, Virtus Health (ASX:VRT) and Monash IVF (ASX:MVF) have both been publicly traded since 2013 and 2014, respectively. Both are relatively mature companies, each paying annual dividends above 5 percent. Virtus Health operates in Ireland, Denmark, UK, and Singapore, in addition to Australia. Monash has expanded beyond Australia to include both Malaysia and China.
Figure 11 shows the relative trailing EBITDA and revenue multiples from December 2014 to December 2019. Even though there are differences between Australian and U.S. healthcare markets, they do share the common demographic trends that lend strength to analyzing these companies. Additionally, the historical performance of these companies as seen in Figure 11 could help private equity investors in the U.S. plan expected exit strategies of their fertility investments via initial public offering.
![]() COMPLEX JOINT VENTURES
COMPLEX JOINT VENTURES
HealthCare Appraisers’ expert guidance has helped numerous firms navigate through complex regulatory valuation issues often found in operations, acquisitions, and joint venture formations. Complex valuation issues often intersect state corporate practice of medicine statutes, insurance requirements, lab referrals, and marketing arrangements to name a few. Participants in the healthcare industry, especially larger firms, make it a standard practice to document compliance policies that require careful examination of relationships with clinical laboratories and healthcare providers. Much attention is spent on federal regulations related to the Stark Law (i.e., physician self-referral law) and Anti-Kickback Statutes. Violations of these programs may incur civil and/or criminal penalties, as well as exclusion from Medicare and other federal and state healthcare programs. While most fertility clinics do not see much (if any) revenue from Medicare, other federal programs and state Medicaid program revenue, is certainly at risk. Additionally, many states have enacted legislation which functions similarly to Stark Law and Anti-Kickback Statutes. Some states, such as Texas, have pursued such cases involving commercial insurance, demonstrating that regulatory violations are a significant risk no matter the financial payors involved.[16]
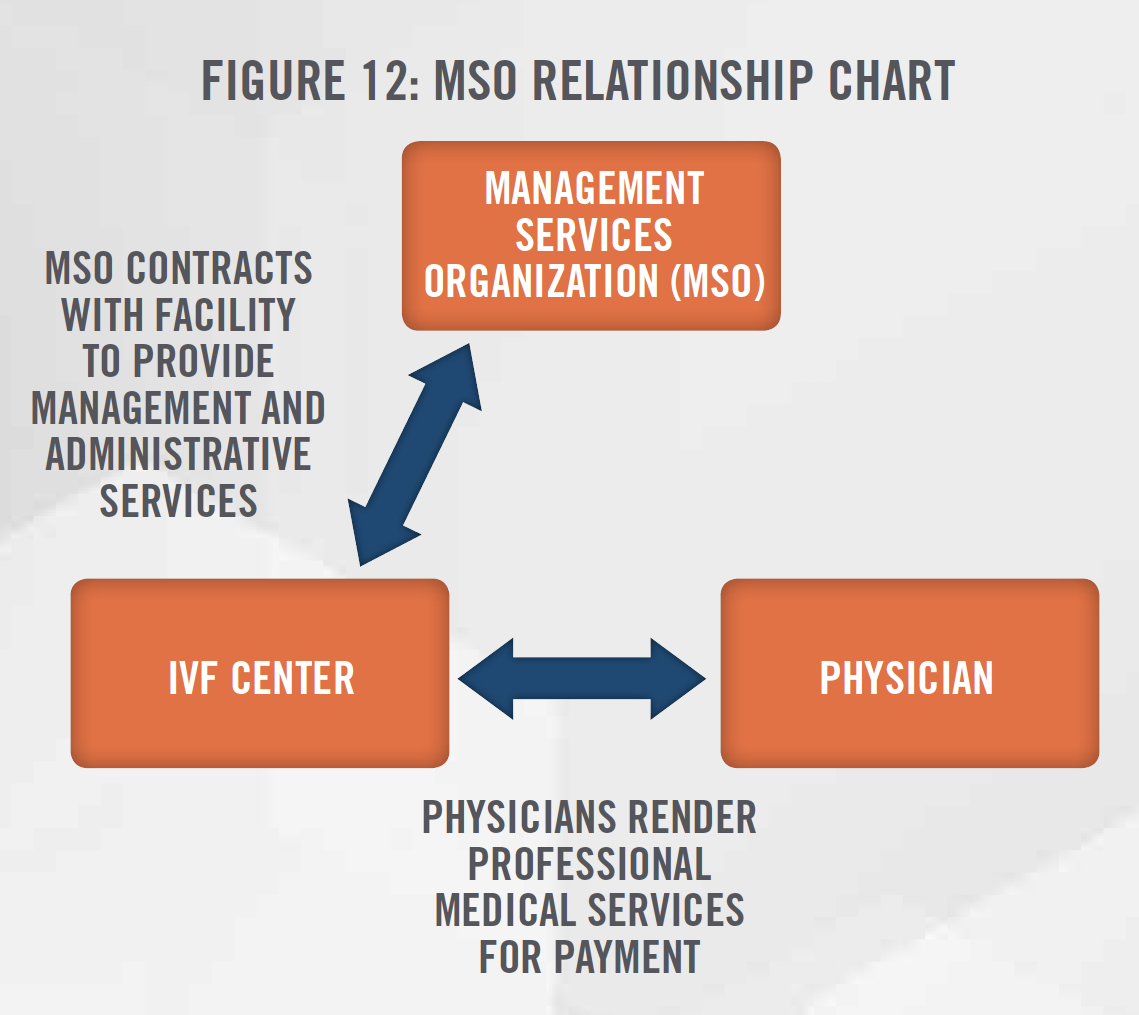
One such remedy for some regulatory risks is the use of Management Service Organizations (“MSOs”). Figure 12 shows a general outline for the structure of a typical MSO relationship, which is necessary when non-physician entities are seeking to align with fertility practices in states with corporate practice of medicine statutes. The entities, prevented by statute from directly employing physicians or owning an interest in a fertility practice, must instead enter into an MSO, also commonly referred to as a “Friendly PC”, arrangement. The MSO, whose owners can be non-physicians, provides management and administrative services, such as proprietary processes, technology applications, billing/collecting, C-suite management, and other non-medical services to the fertility practice in exchange for a management fee. This allows the physician owners of the fertility center to focus solely on the rendering of medical services. MSO structures can thus be used by fertility clinics to maintain compliance with corporate practice of medicine doctrines, and with other requirements.
![]() VALUATION APPROACHES
VALUATION APPROACHES
Three standard approaches should be considered when determining the value of fertility practices: the Income, Market, and Cost Approaches.
Income Approach: The income approach generally attempts to quantify the future economic benefits derived from the due course of business. An expert will carefully gather relevant data (including expected revenue, expenses, etc.) to forecast the resulting cash flows from the business activity. These future cash flows are then adjusted back to present value using a risk adjusted rate of return. This methodology is better known as the Discounted Cash Flow method, although other methodologies exist that fall under the Income Approach. One such method is the Capitalization of Future Maintainable Earnings, which is typically used for businesses that are expected to maintain relatively stable levels of future cash flows. The income approach is likely to be used when valuing a profitable, going-concern fertility practice.
Market Approach: The market approach attempts to quantify the value of the fertility practice based on other similar practices in the marketplace. An expert could look to market transactions, where fertility practices have been acquired by or merged into a buying firm. While detailed information on these transactions can be difficult to ascertain, closed transactions provide valuable insight when such information can be analyzed. The valuation multiples from these transactions (e.g., Enterprise Value/EBITDA) can be analyzed, adjusted when appropriate, and then be applied to the subject fertility practice to produce an indication of value.
In addition to market transactions, an expert can also analyze public markets to determine appropriate valuation multiples. As mentioned, there are no pure-play fertility practices in the U.S. marketplace. However, by looking at the Australian comparables in Figure 11, an expert could use these multiples as a starting point or sanity check for evaluating a subject fertility practice. An expert will need to determine which, if any, discounts or premiums apply for the subject fertility practice valuation.
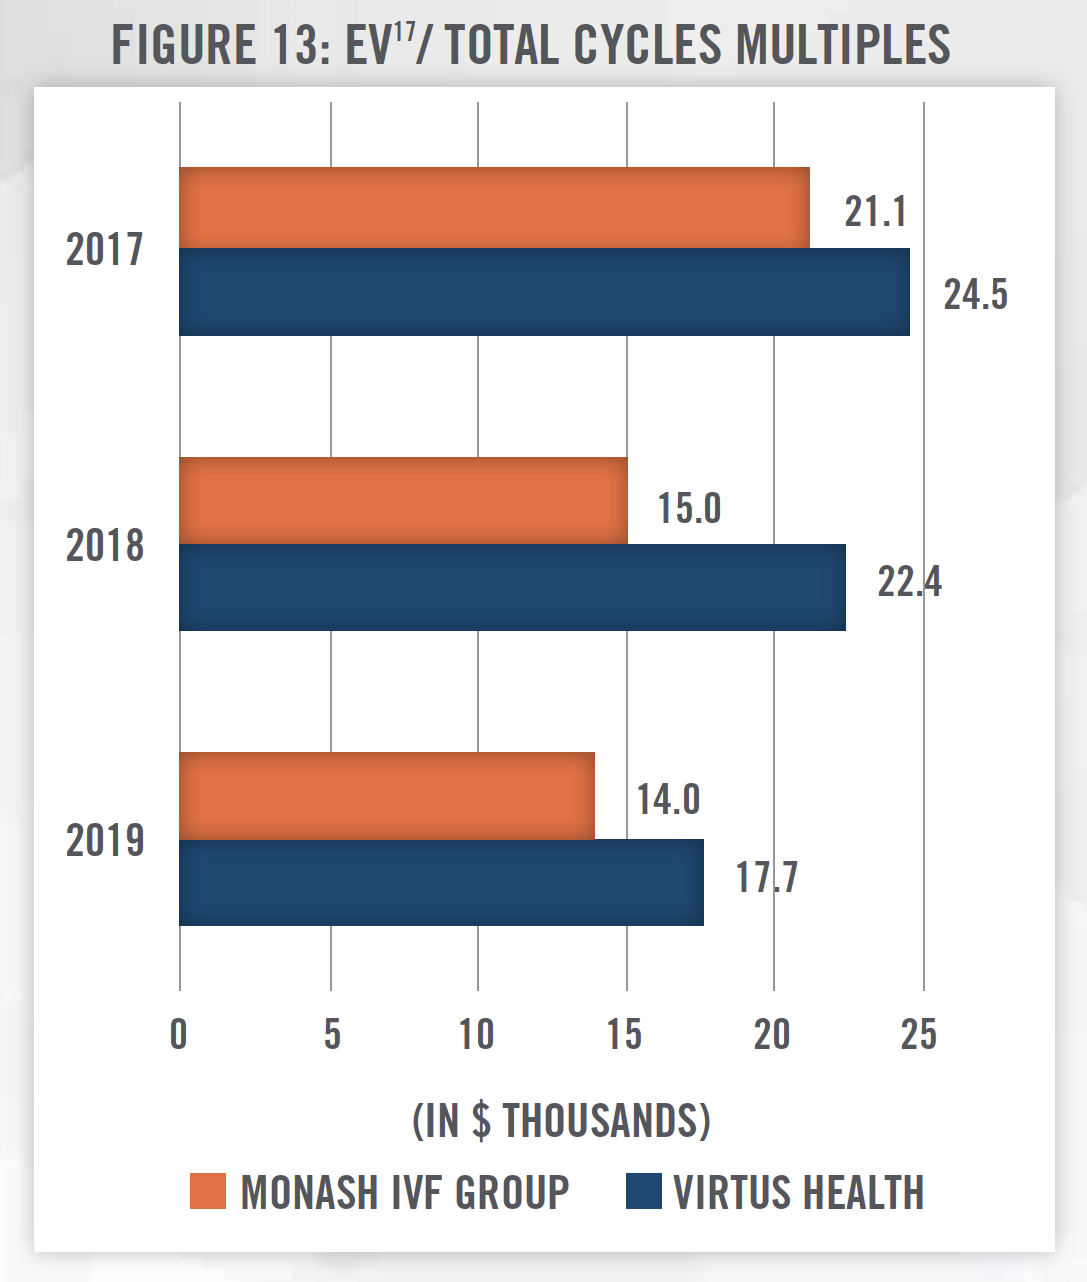
While multiples such as EV/EBITDA and EV/Sales are common valuation multiples to consider, an expert might explore using other multiples in valuing a start-up or unprofitable practice. One such multiple might be EV/Total Cycles, which compares Enterprise Value to the annual total ART Cycles performed. Figure 13 shows what such a multiple might look like when using our two known Australian public comparables. An expert might consider an indication of value based on the number of cycles performed where use of a traditional multiple (e.g., EV/EBITDA) yields non-meaningful indications of value. However, an expert must also be cautious that value is not artificially created or lost in its application. For example, if one used the EV/Total Cycles multiple to value a fertility practice with considerable other profitable services, the value of those ancillary services may not be reflected in the indication of value, thus undervaluing the subject fertility practice.[17]
Cost Approach: The cost approach attempts to quantify the total costs incurred if one were to “build-up” a new fertility practice. This approach requires careful consideration of all aspects of building a new practice. An expert would consider factors such as facilities, capital assets, and the workforce required to operate a fertility practice. As discussed earlier, there are considerable supply restraints on both new fertility clinics and qualified physicians. An expert would need to be careful in considering the accurate expenditures required to replicate a fertility practice. A cost approach might also be considered when valuing startup or unprofitable fertility practices.
![]() SUMMARY
SUMMARY
The confluence of social and demographic trends has caused demand for fertility services to spike. However, U.S. supply for those services has not increased much over most of the last decade, as capacity has seemingly scaled well to handle the increased demand. Private equity firms have sensed an opportunity in this space, and they have begun to invest millions of dollars of capital. However, without proper consulting or planning, the expected returns of these private equity firms may be limited by both federal and state regulations, leading to unwelcome surprises and difficult decisions. HealthCare Appraisers has helped guide numerous clients in the valuation of their fertility practices across the U.S. with our thorough analysis and expertise in the healthcare industry.
[1] Centers for Disease Control & Prevention: www.cdc.gov/nchs/data/hus/2018/001.pdf
[2] Pew Research Center, www.pewresearch.org/fact-tank/2015/05/08/ideal-size-of-the-american-family/
[3] Centers for Disease Control & Prevention: www.cdc.gov/nchs/data/hus/2018/001.pdf
[4] Centers for Disease Control & Prevention: www.cdc.gov/reproductivehealth/Infertility/index.htm
[5] Centers for Disease Control & Prevention: www.cdc.gov/nchs/fastats/infertility.htm
[6] Fertility & Sterility, American Society for Reproductive Medicine: https://www.fertstert.org/articleS0015-0282(15)02315-8/abstract
[7] PitchBook database, accessed October 28, 2019. 2019 figures are not annualized.
[8] ibid.
[9] http://www.invitrosciences.com/news/posts/2019/october/sverica-capital-management-announces-investment-in-in-vitro-sciences/
[10] S&P Capital IQ
[11] https://www.cdc.gov/art/artdata/docs/excel/FINAL-2017-Clinic-Table-Dataset.xlsx
[12] Based on HAI proprietary research and analysis. Logarithmic trendline; R-squared value of 0.5584.
[13] Average costs based on internally sourced, unsubsidized rates. Costs paid by consumers is typically partially subsidized by public funding in most non-U.S. countries. For the purposes of extrapolation of market revenue in the U.S., nonsubsidized rates are shown. Additionally, prices for IVF cycles vary considerably based on the facts and circumstances of each patient’s case. Generally, the public subsidy is around 50 percent of the prices shown herein.
[14] Reproductive Biomedicine Online, Volume 38, Issue 2, 2019: https://www.rbmojournal.com/article/S1472-6483(18)30598-4/pdf
[15] S&P Capital IQ, quarterly data. Each horizontal line indicates, from the bottom up, the minimum, 25th percentile, median, 75th percentile, and maximum quarter-end ratio from December 2014 – December 2019. The white dot represents the December 2019 ratio.
[16] Daily Healthcare Magazine: www.healthcare.dmagazine.com/2019/03/14/north-texas-hospital-ceo-pleads-guilty-to-millions-in-fraud/
[17] Converted EBITDA from AUD to USD using the spot rate as of June 30 of each year