Authors: Matthew J. Muller, ASA, and Nicholas J. Janiga, ASA

In August 2023, the Centers for Medicare & Medicaid Services (CMS) released 2022 Performance Year Financial and Quality Results data related to the Medicare Shared Savings Program
(MSSP).[1] In total, there were 482 Accountable Care Organizations (ACOs) that participated in the 2022 performance year, including – in the aggregate – over 573,000 participating providers serving nearly 11 million total beneficiaries. The underlying data released reflects that overall, the program has been financially beneficial for both Medicare and MSSP participant ACOs.
Figure 1 reflects statistics related to the savings rates experienced by the 482 ACO participants in 2022. 405 of the 482 participants, or 84 percent, achieved a positive savings rate in 2022, and 63 percent of the ACOs were eligible to receive shared savings payments.[2]
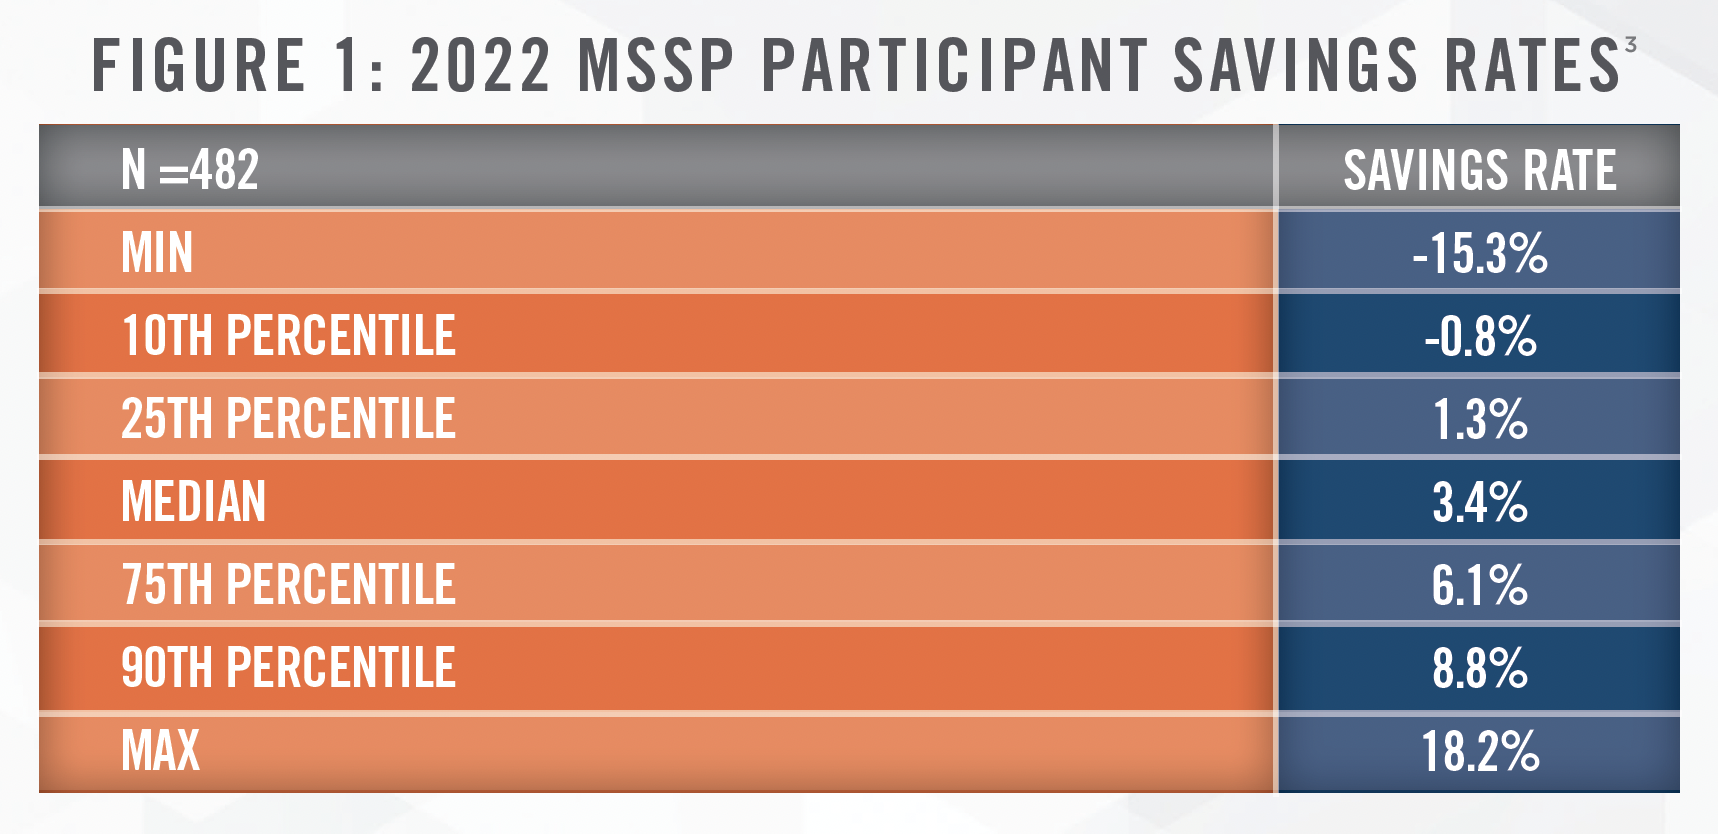
Among the 482 participants in aggregate, over $4.3 billion of total savings[4] were generated in the 2022 performance year, of which over $2.5 billion in net earned shared savings payments/owed losses[5] were made to the ACO participants. This yielded approximately $1.8 billion in net total savings for Medicare.
As outlined in Figure 2, the majority of the ACOs participated in a two-sided shared savings/losses model for the 2022 performance year, as compared to a one-sided shared savings model.
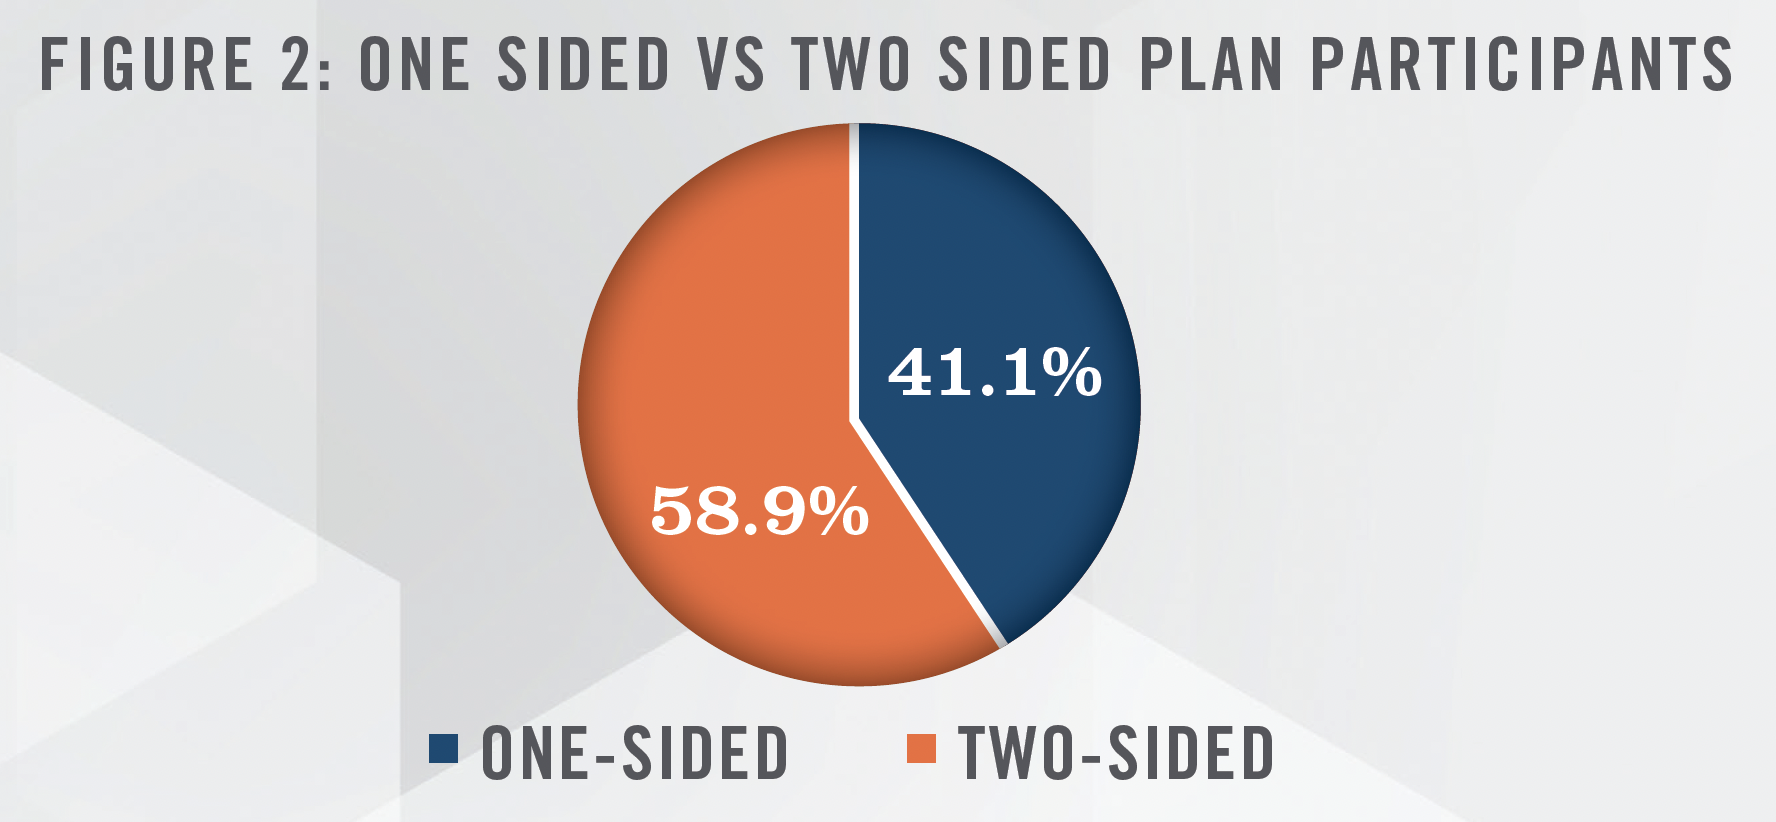
Sizes of the participant ACOs – as defined by number of assigned beneficiaries – varied, as outlined in Figure 3:
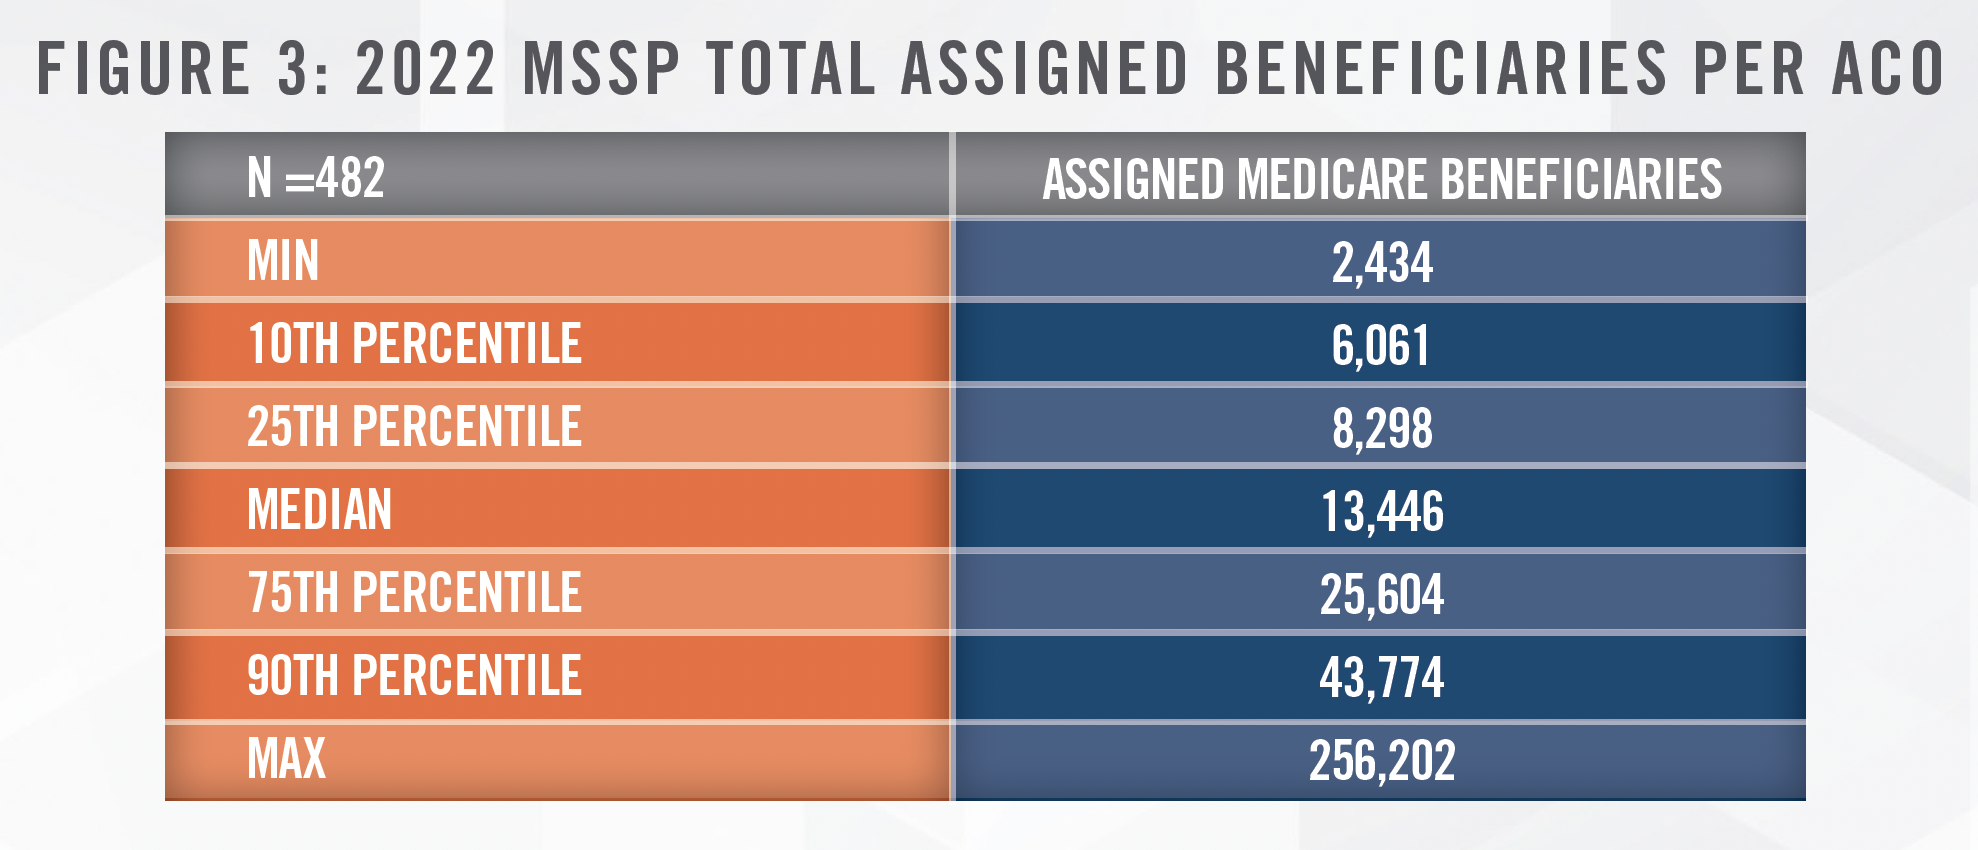
The top ten largest ACOs, measured by number of assigned beneficiaries, are outlined in Figure 4. This cohort of participant ACOs encompasses approximately 13 percent of total Medicare beneficiaries assigned to MSSP ACOs in 2022.
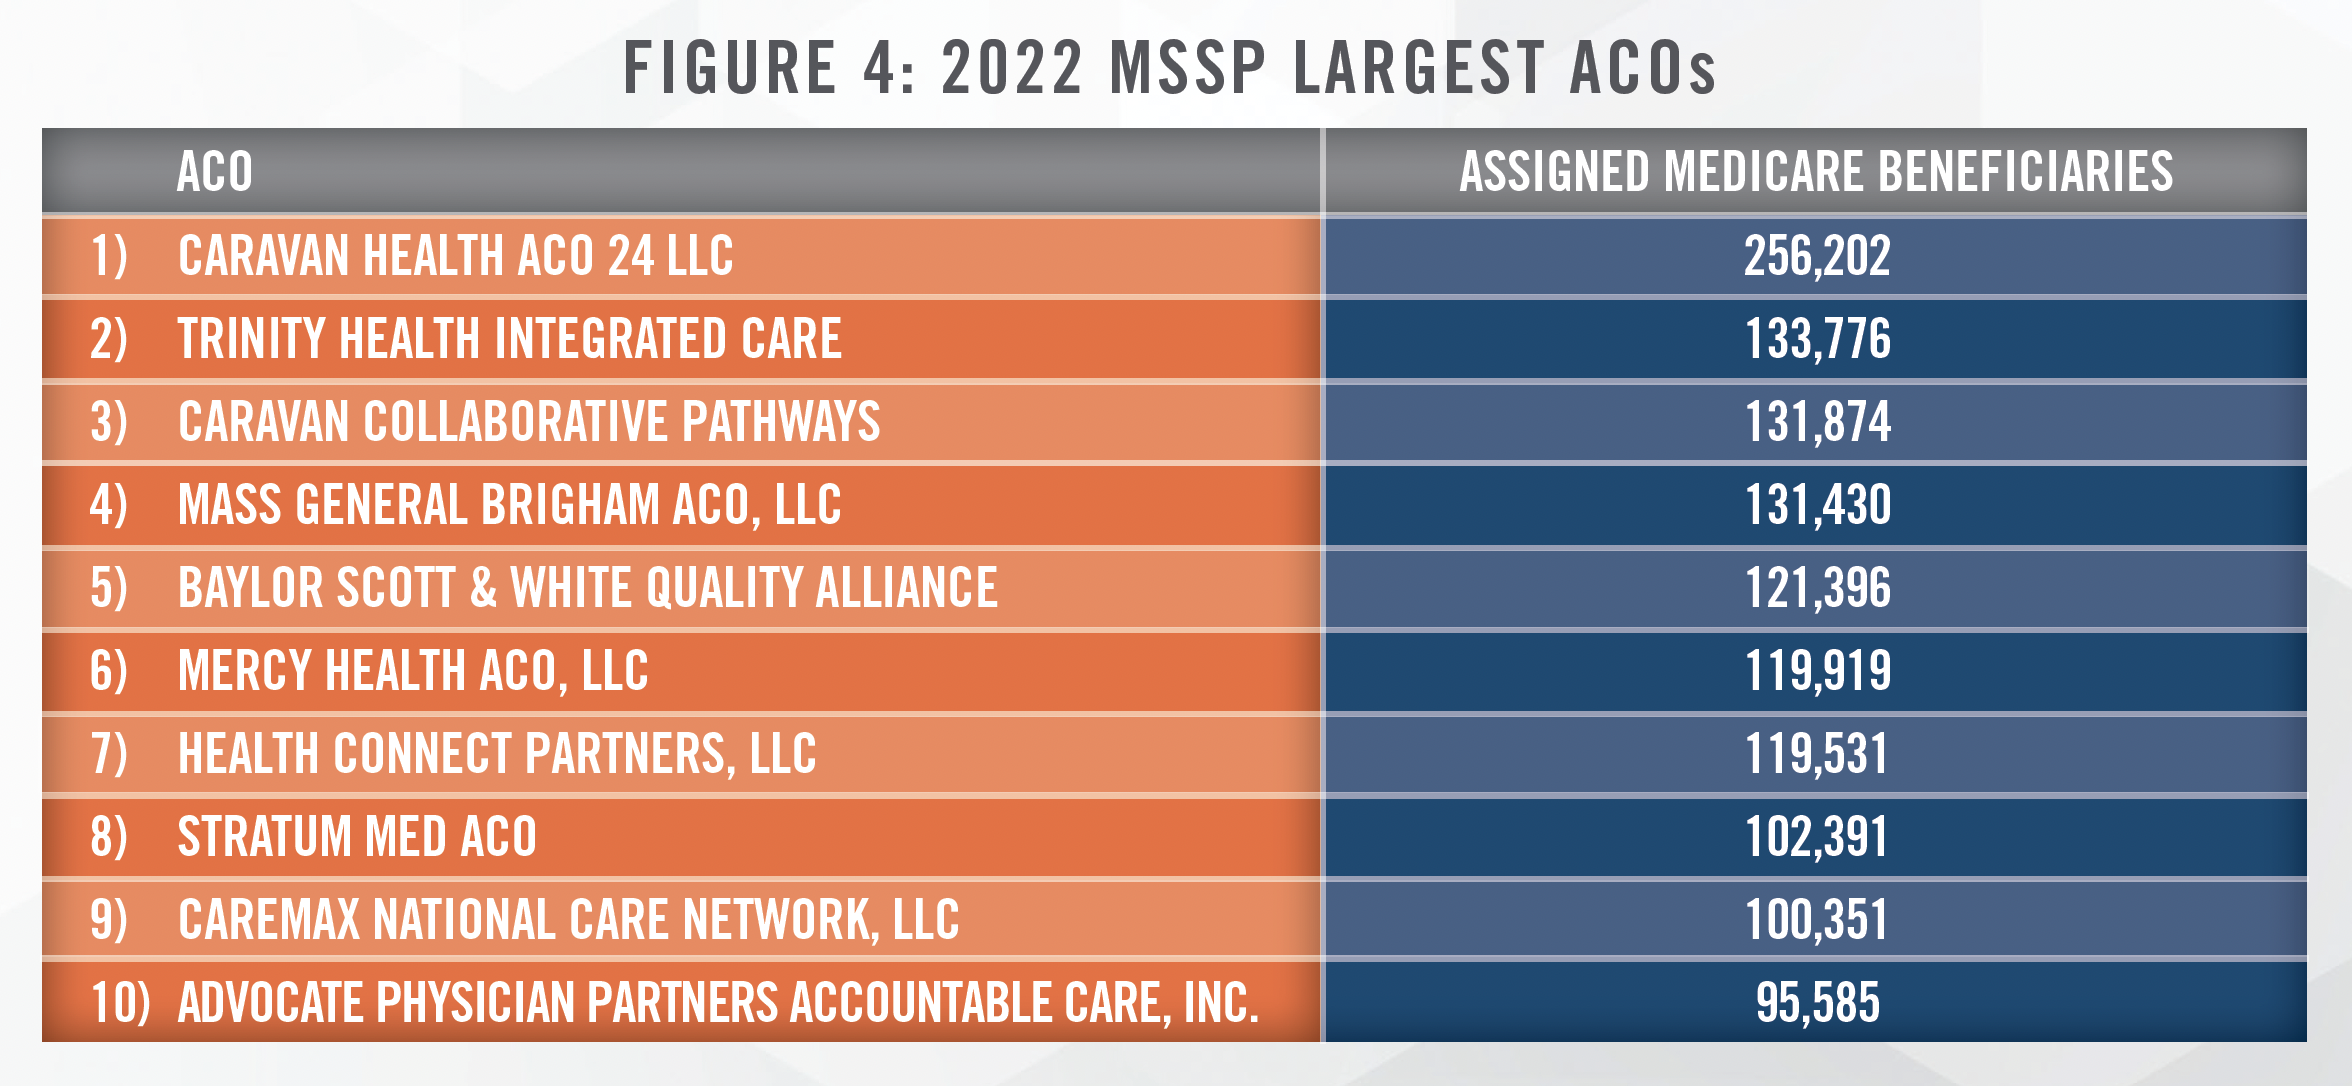
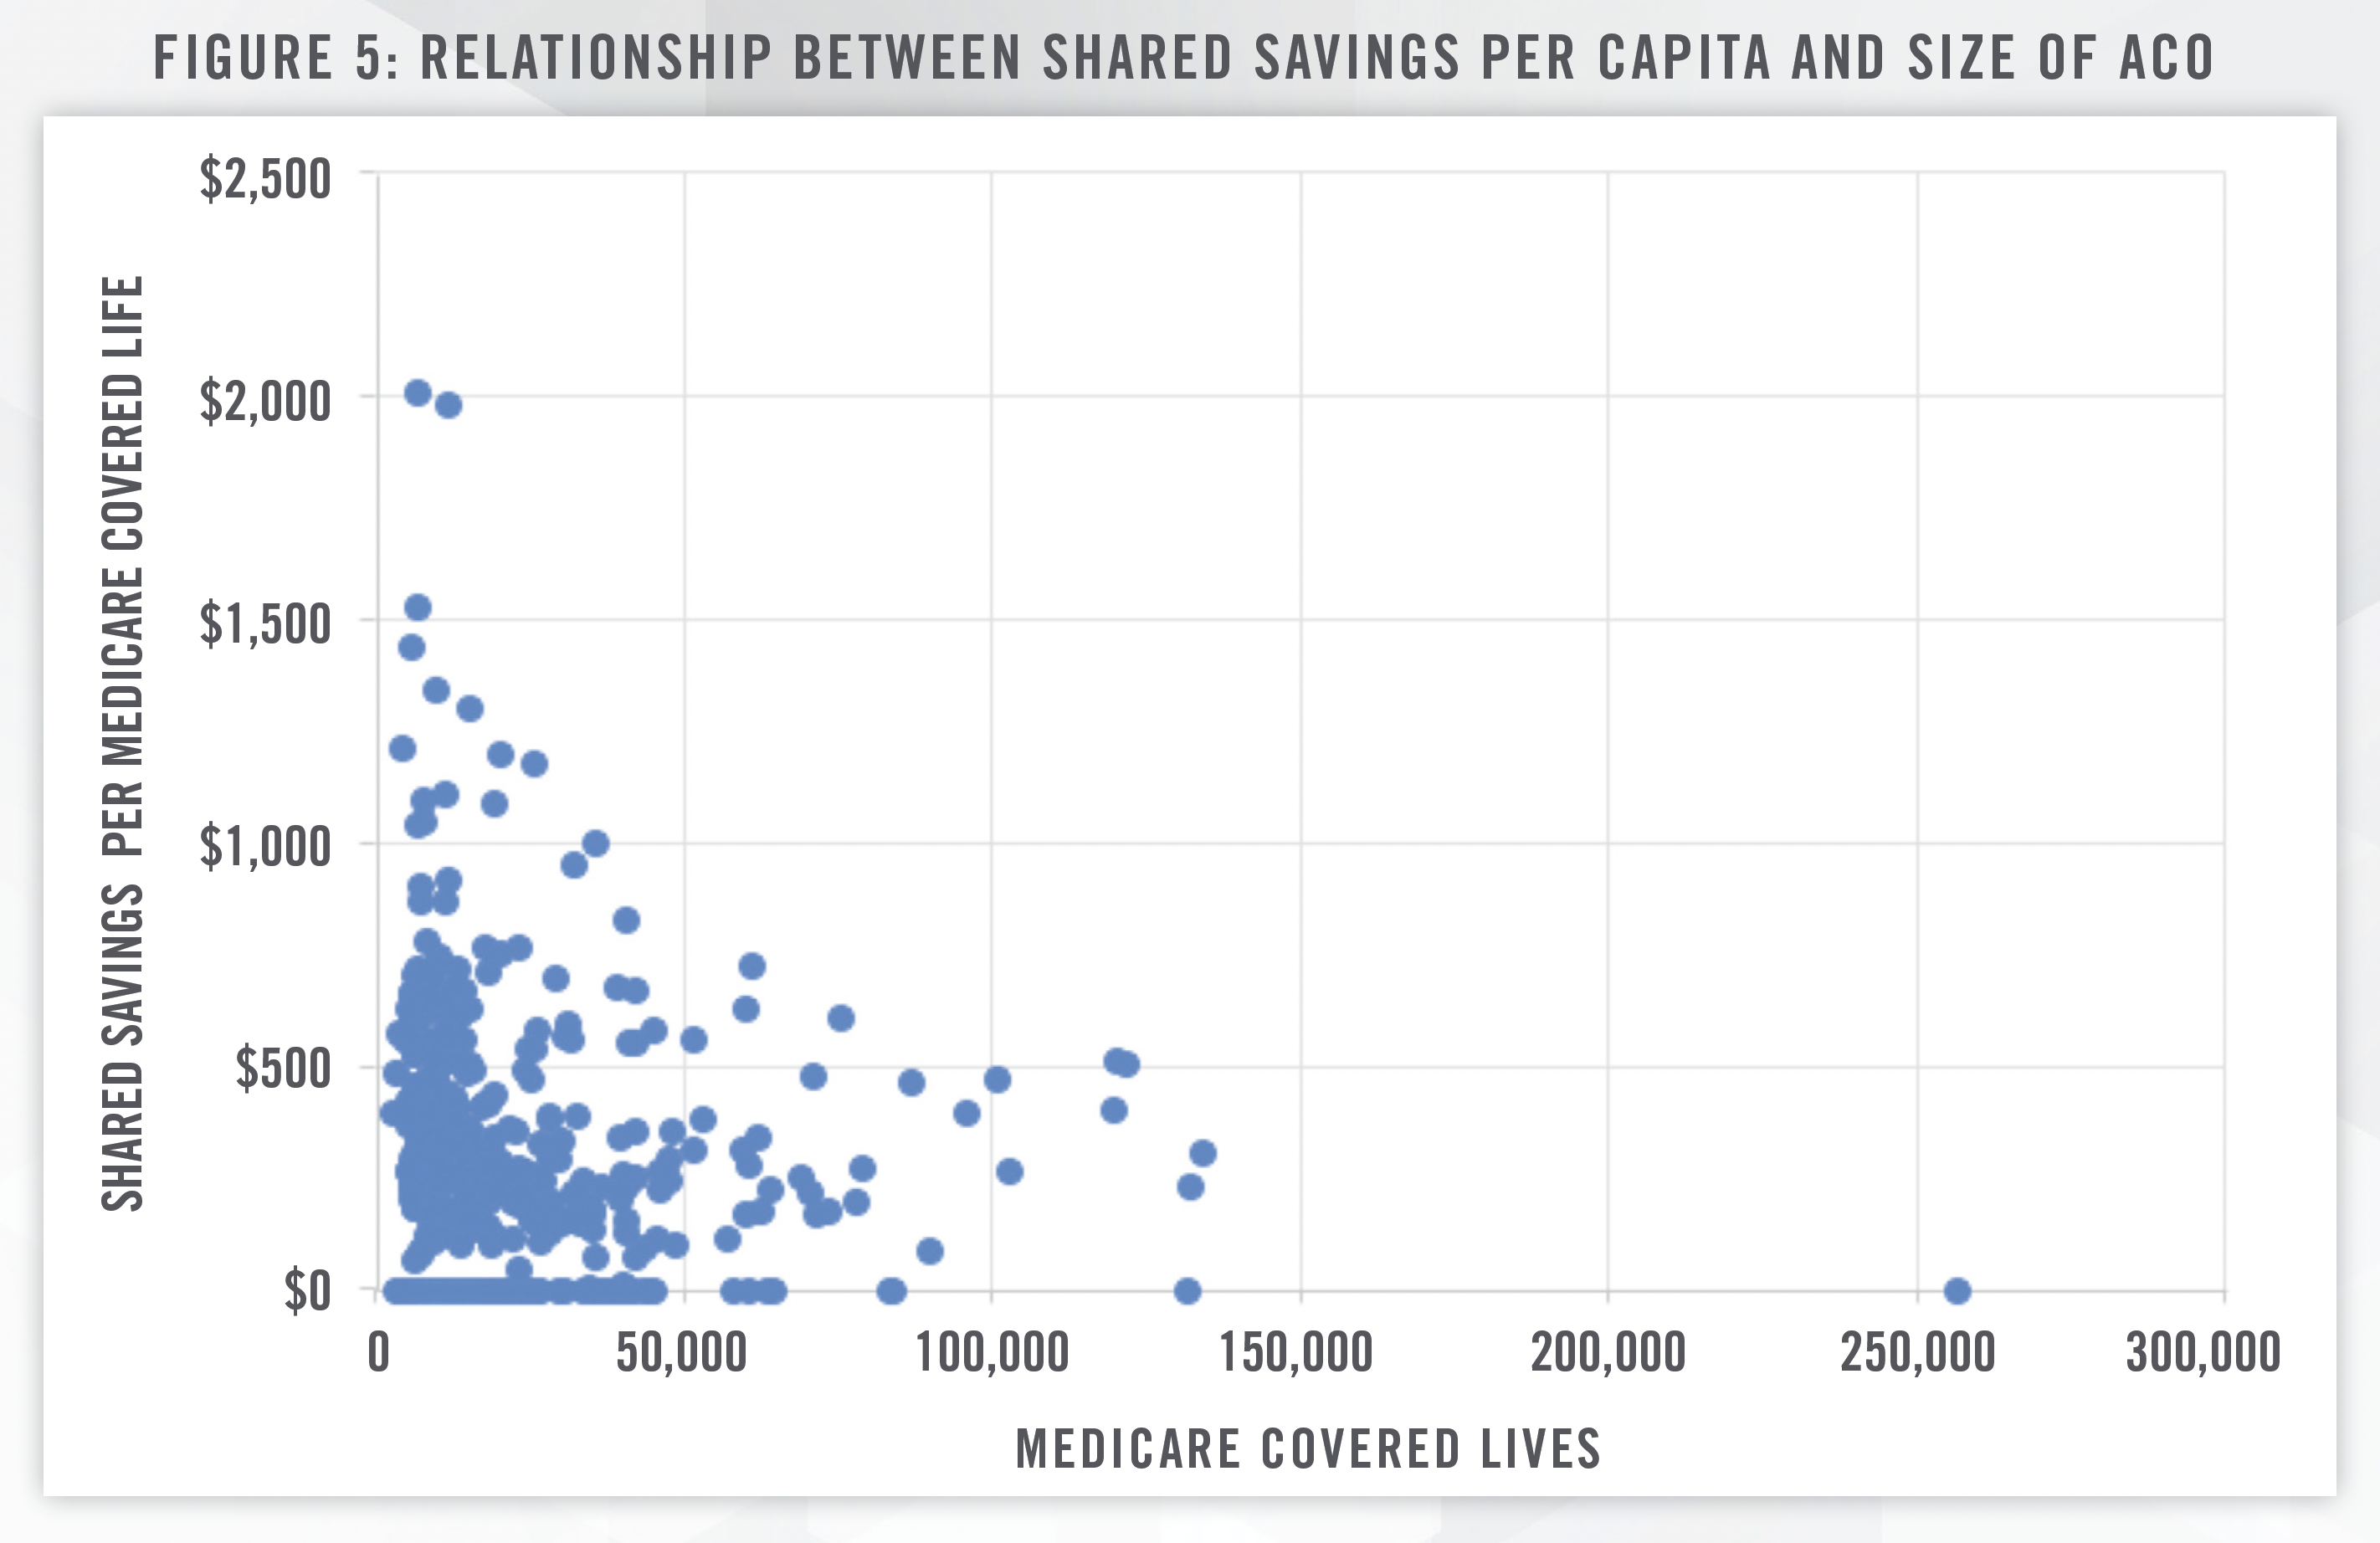
It is noteworthy that larger sized ACOs did not necessarily yield a higher shared savings amount per capita. CMS reports that ACOs that earned more in shared savings tended to be low revenue ACOs, which are typically “made up of physicians, and include a small hospital or serve rural areas. With $228 per capita in net savings, low revenue ACOs led high-revenue ACOs, who had $140 per capita net savings, and low-revenue ACOs comprised of 75% primary care clinicians or more saw $294 per capita in net savings, more than twice as much.”[6] CMS distinguishes high and low revenue ACOs on the basis of total fee for service (FFS) revenue compared to benchmark expenditures; a “low revenue” ACO’s total Medicare Parts A and B FFS revenue is, as defined by CMS, less than 35 percent of total Medicare Parts A and B expenditures for the ACO’s assigned beneficiaries.[7]
The future appears bright for ACOs, as CMS continues to develop and refine ACO models to better serve the Medicare population. In 2023, the ACO Realizing Equity, Access, and Community Health (ACO REACH) Model launched with 132 ACOs providing care for approximately 2.1 million beneficiaries. A goal of the ACO REACH Model is to increase access to accountable care in underserved communities.[8]
Distributions from ACOs to ACO participants have historically averaged between 50 and 60 percent of earned shared savings.[9] While shared savings distributions under MSSP are subject to waivers of the Physician Self-Referral Law and Anti-Kickback Statute, careful analysis of the economics of these ACO arrangements can provide insight into reasonable provider distribution amounts under integrated care delivery models that are not subject to this waiver authority. A valuation professional with expertise in value-based arrangements can assist your organization in designing incentive plans that achieve your care coordination objectives, reward providers for their contributions to improved care delivery, and ensure compliance with fraud and abuse laws and other requirements. Please contact HealthCare Appraisers today to learn how we can help.
[1] Accessed August 30, 2023 from: https://data.cms.gov/medicare-shared-savings-program/performance-year-financial-and-quality-results
[2] Ibid.
[3] Savings rate defined by CMS as total benchmark expenditures minus assigned beneficiary expenditures as a percent of total benchmark expenditures.
[4] Defined by CMS as Total Benchmark Expenditures Minus Assigned Beneficiary Expenditures.
[5] Defined by CMS as Total earned shared savings: The ACO’s share of savings for ACOs whose savings rate was equal to or exceeded their minimum savings rate (MSR) and met the program’s quality-based eligibility requirements for a performance payment. This amount accounts for the application of the ACO’s final sharing rate based on quality performance (depending upon ACO track), as well as applicable reductions in performance payment due to sequestration and performance payment limits. This amount does not account for repayment of advance payments. Total earned shared losses: The ACO’s share of losses for ACOs in two-sided tracks whose losses rate were equal to or exceeded their minimum loss rate (MLR). This amount accounts for the application of the ACO’s final loss sharing rate based on quality performance (depending upon ACO track), the applicable loss sharing limit, and any automatic extreme and uncontrollable circumstances (EUC) adjustment.
[6] Accessed August 30, 2023 from: https://www.cms.gov/newsroom/press-releases/medicare-shared-savings-program-saves-medicare-more-18-billion-2022-and-continues-deliver-high
[7] Accessed September 7, 2023 from: https://www.naacos.com/naacos-assessment-of-high-low-revenue-designations
[8] Accessed August 30, 2023 from: https://www.cms.gov/newsroom/press-releases/cms-announces-increase-2023-organizations-andbeneficiaries-benefiting-coordinated-care-accountable
[9] Based upon ACOs’ self-reported proportions of MSSP earnings distributed to ACO participants.
