HealthCare Appraisers has recently observed interest from a wide range of clients on various radiology transactions, including joint venture formation, hospital outpatient department (“HOPD”) conversions, practice and independent diagnostic testing facility (“IDTF”) acquisitions by health systems and other strategic acquirers, and hospital-based radiology services arrangements, among others. Diagnostic imaging centers, along with many other healthcare providers and operators, experienced strong utilization throughout 2023, and some of the largest operators in the space expect this trend to continue. For example, RadNet, Inc. (“RadNet”) reported significant backlogs on its recent earnings calls with investors and currently has 12 de novo centers under construction.[1] This article discusses the major trends impacting the imaging industry, including the shift from hospital departments to IDTFs, the regulatory and reimbursement landscape, the use of artificial intelligence and machine learning within the industry, consolidation of radiology practices, and valuations within the industry.
![]() IMAGING MARKET BACKGROUND
IMAGING MARKET BACKGROUND
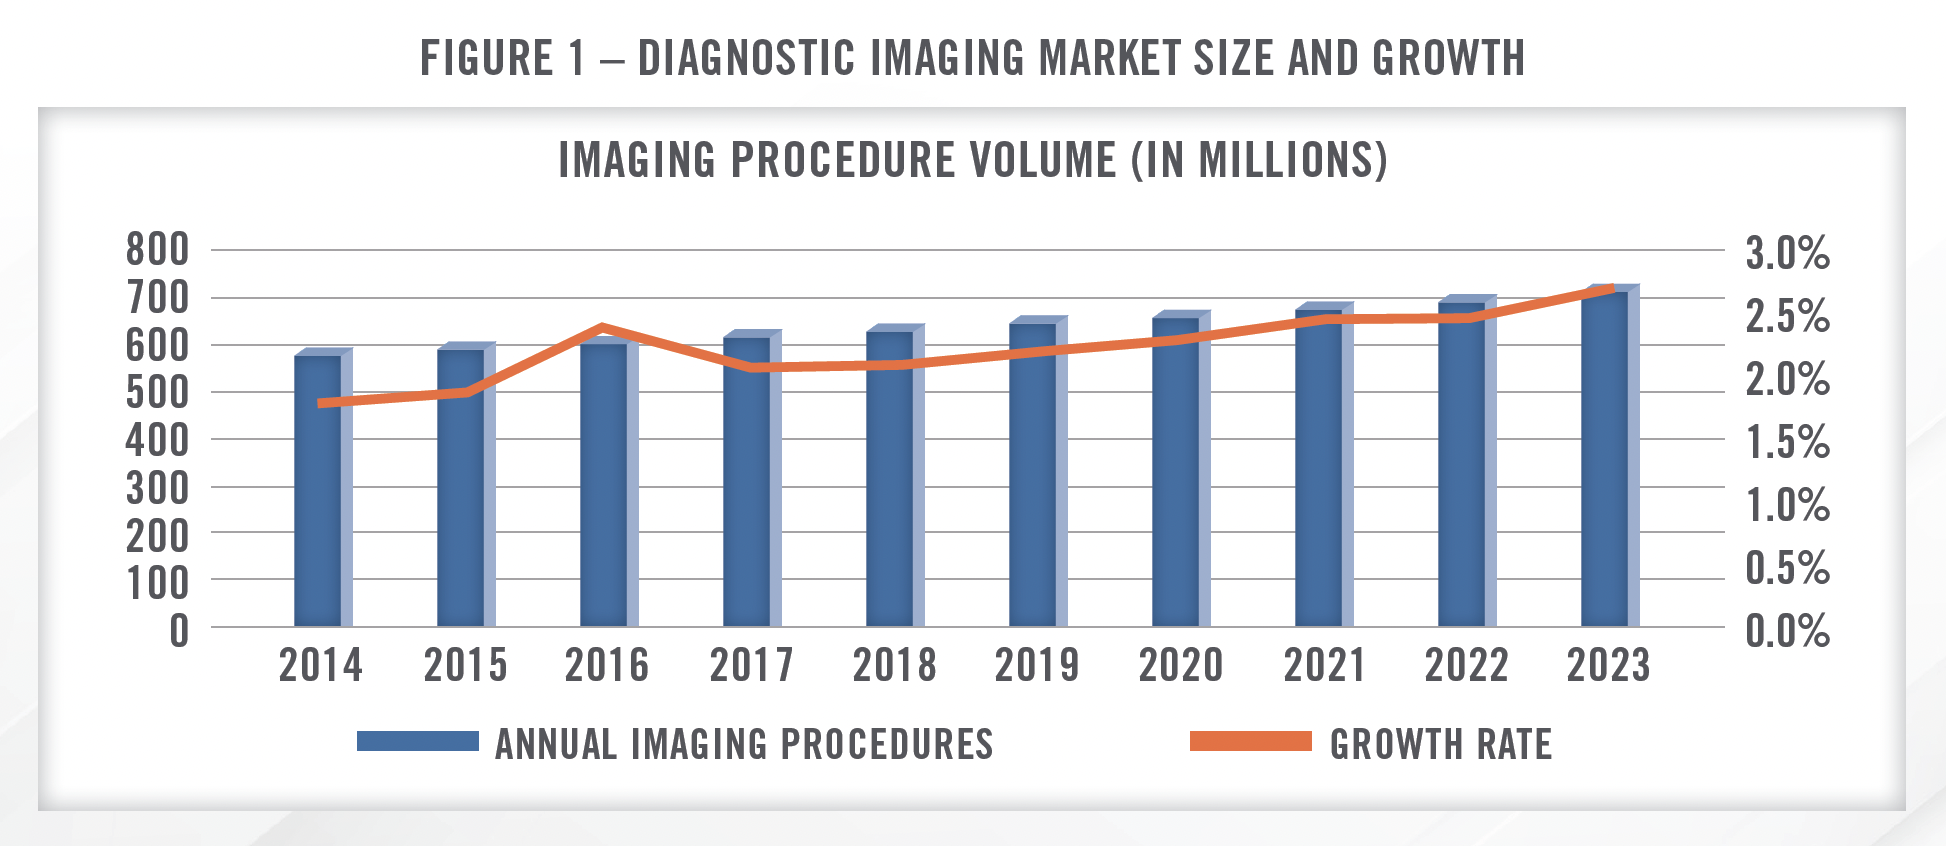
The imaging market in the United States is estimated to generate revenue of more than $100 billion[2] annually, with radiology practices and imaging centers accounting for approximately $23.8 billion[3] in annual revenue. Annual imaging procedures have been growing at a low single digit pace and are projected to continue to grow at a low single digit pace, with a modest acceleration in growth rates in the coming years (Figure 1).
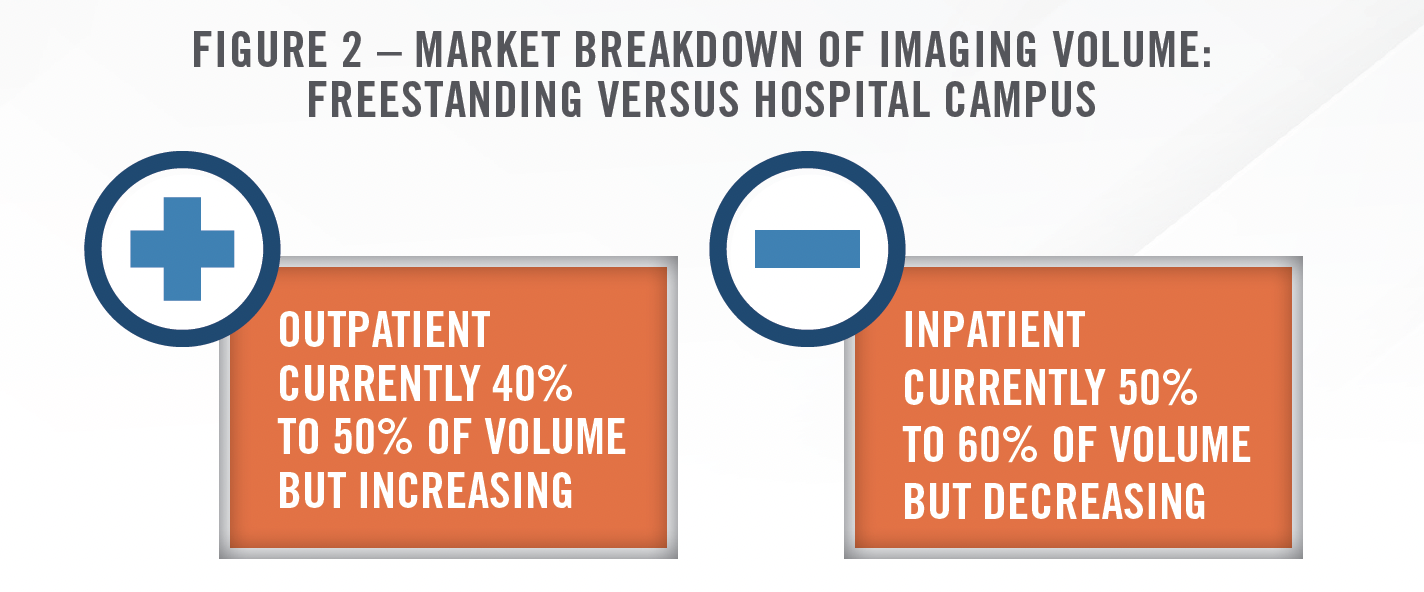
Approximately 40 to 50 percent of imaging volume is performed at outpatient imaging centers and physician clinics, while the remaining 50 to 60 percent is conducted within hospitals (Figure 2). Within the outpatient segment, there are approximately 6,800[4] IDTFs in what is a highly fragmented market.
![]() HOSPITAL DEPARTMENT OUTMIGRATION
HOSPITAL DEPARTMENT OUTMIGRATION
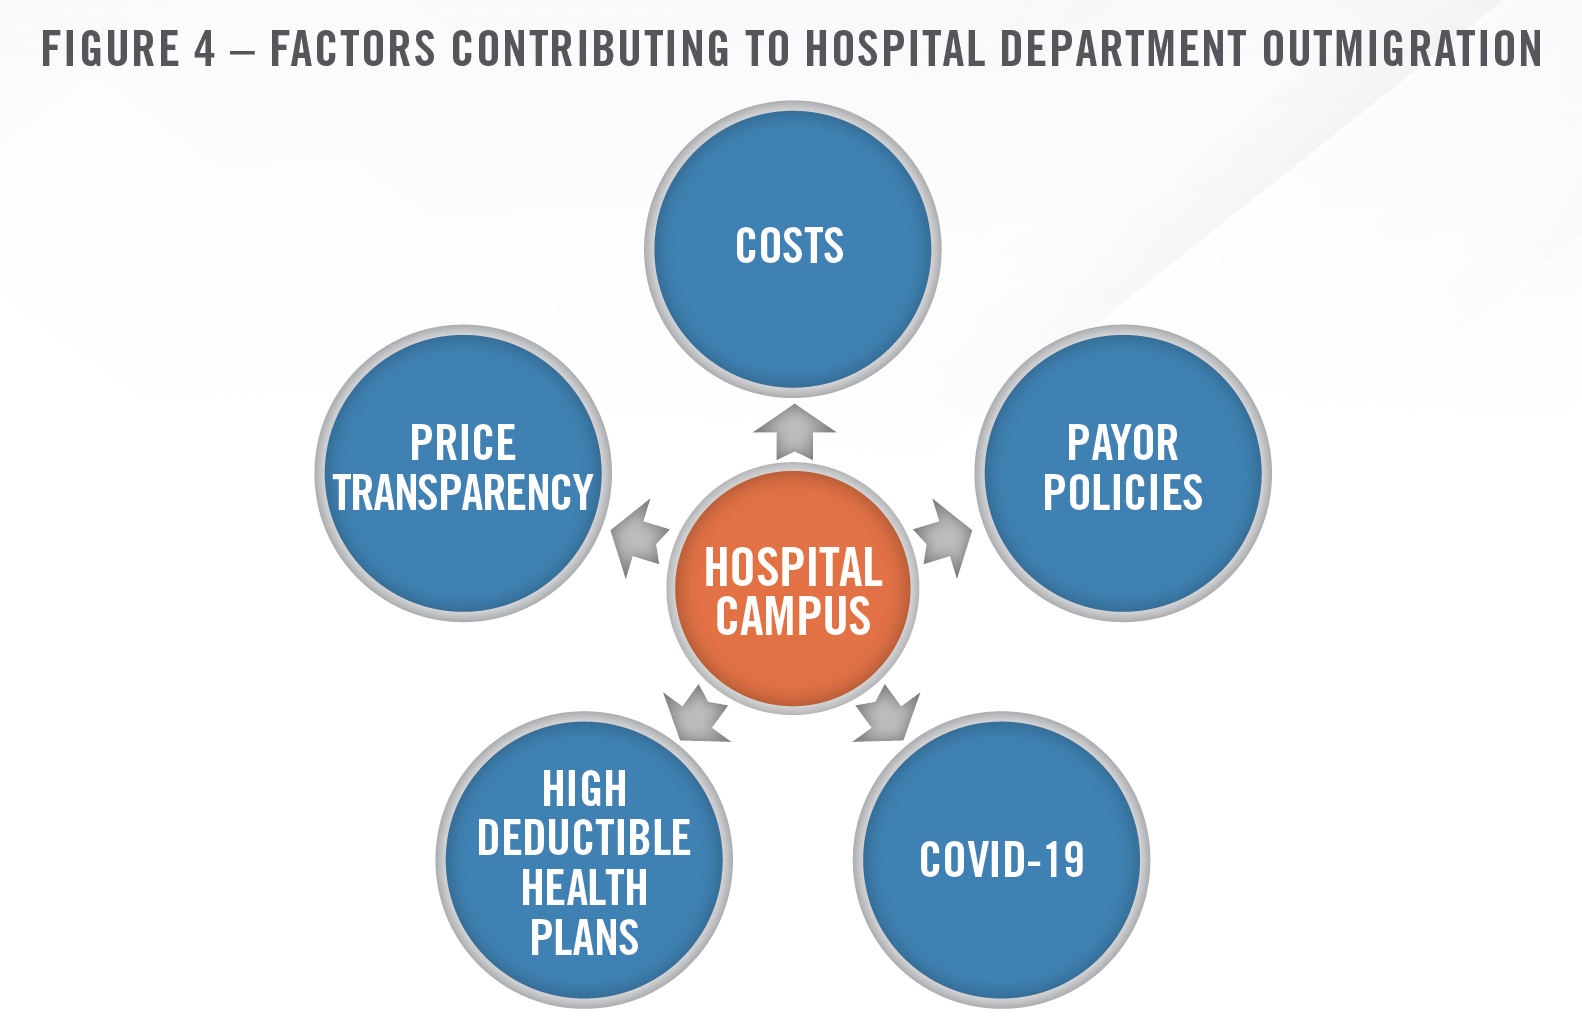
One of the major ongoing trends impacting the diagnostic imaging industry is the shift of inpatient volumes away from the hospital setting. Diagnostic imaging volumes have been shifting away from hospital campuses due to the lower cost of performing these procedures at IDTFs, site neutral payment policies from CMS, and site of care reviews during the prior authorization processes implemented by private payors in the last few years. Site neutral payment policies make hospital department imaging procedures less profitable, thus not allowing them to support the higher expense structure and instead seek joint venture partnerships as IDTFs. Estimates regarding the percentage of procedures that could be impacted by site of review policies from private payors range from 80 to 90 percent in non-rural markets[5], suggesting that the impact to hospitals as a result of these policies, especially if implemented by additional payors, could be substantial.
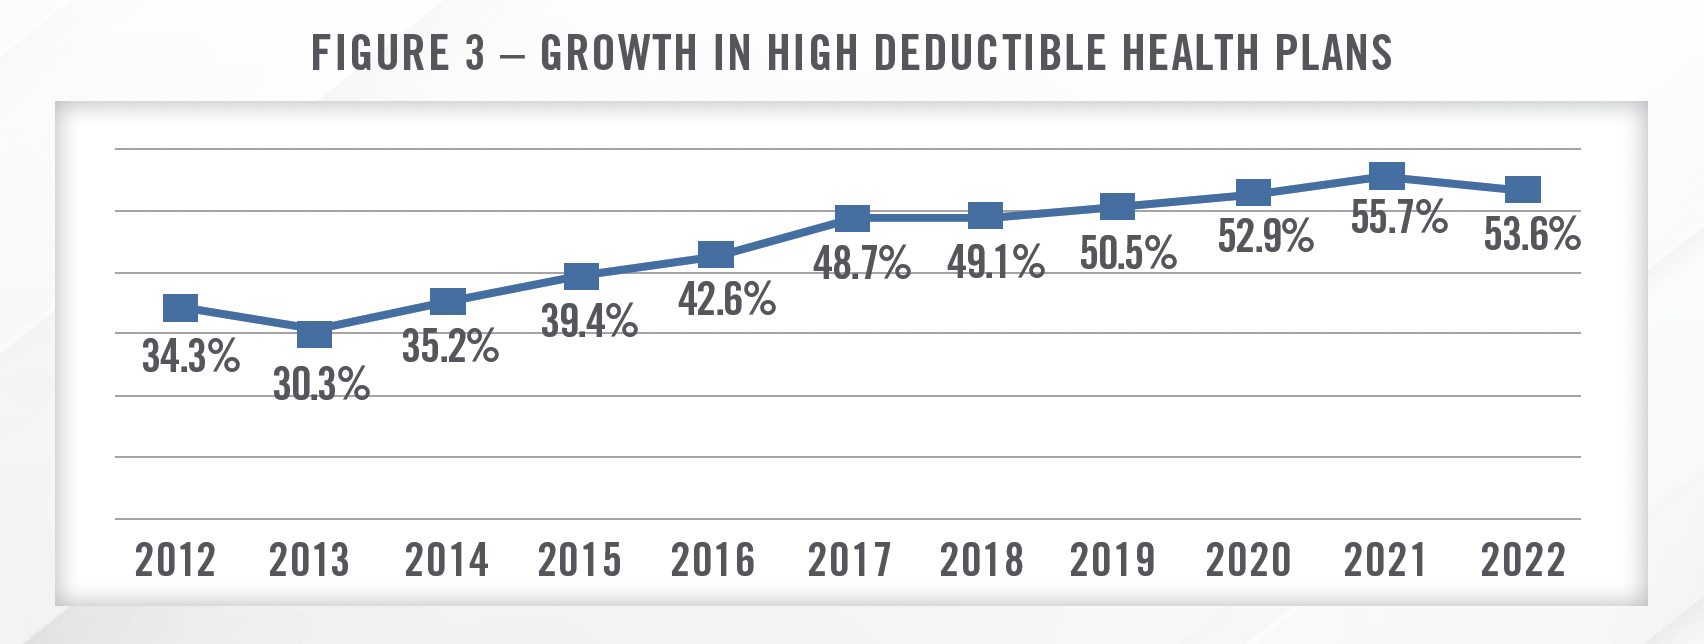
In addition to action by payors, the rise of high deductible health plans and recent price transparency regulations may accelerate the trend toward lower cost settings. Radiologic imaging is one area of healthcare in which there is a well-documented elasticity of demand, resulting in price discrepencies for comparable services having a large impact on consumer behavior.[6] Price transparency regulations make it easier for consumers to ascertain comparative price information prior to choosing a site of service. These regulations, coupled with the trend toward high deductible health plans (outlined in Figure 3, which illustrates that high deductible health plans have increased from approximately 30 percent of the private insurance market to more than 50 percent in recent years[7]) in which consumers are more incentivized to price shop for healthcare services, should create an environment in which IDTFs continue to gain market share.
Convenience is also a factor driving consumer behavior as visiting an IDTF for a scan is generally easier than navigating a hospital campus. Additionally, COVID-19 accelerated the shift away from hospital campuses as patients either elected not to, or were precluded from going to, hospital campuses during the acute phase of the pandemic.
![]() JOINT VENTURE ACTIVITY
JOINT VENTURE ACTIVITY
The shifting of diagnostic imaging volume to the IDTF setting has driven provider strategies in a variety of ways, including the formation of joint ventures. As indicated in the quote from RadNet’s CEO, infra, nonhospital providers of radiologic imaging (and many other healthcare services as well) are increasingly receiving interest from hospitals and health systems regarding joint venture arrangements. These joint venture IDTFs provide benefits to both parties, as hospitals are able to mitigate some of the negative impact from lost volume, as well as provide physicians and patients with a wider range of imaging service options. IDTFs benefit from increased volume from hospitals and potentially better reimbursement rates from payors as partnerships with health systems provide IDTFs with more negotiating power.
We now have 3 joint ventures with Cedars-Sinai encompassing 16 locations in the West Side, Downtown and San Fernando Valley areas of Los Angeles. As an increasing amount of patient volumes are being directed away from expensive hospital-based imaging procedures towards more cost-effective ambulatory outpatient settings, hospitals and health systems are seeking valuable long-term strategies for outpatient imaging. This is leading to increased interest among hospitals and health systems to engage with us in partnerships, discussions and outpatient strategies. RadNet’s current partners are some of the largest and most successful systems in our geographies, including RWJ Barnabas, MemorialCare, Dignity Health, Lifebridge, University of Maryland Medical System, Cedars-Sinai and others. Our hospital and health system partners have been instrumental in increasing our procedural volumes through their relationships with physician partners. Additionally, the joint venture partners are helpful in providing support, if needed, in establishing long-term equitable outpatient reimbursement rates for our services. After giving effect to the expanded Cedars-Sinai relationship, 130 of our 366 centers or 36 percent are now held within health system partnerships.
Despite the trend toward establishing joint ventures as IDTFs, HealthCare Appraisers continues to see some interest in converting IDTFs to HOPDs in certain markets (primarily rural markets) in order to capture the higher reimbursement. In order to qualify as an HOPD, the imaging service must be meet certain requirements, including, among others, location/distance from the hospital facility or campus, providerbased status, and licensing and certification. Hospital outpatient prospective payment system (“OPPS”) reimbursement rates are significantly higher than the Medicare Physician Fee Schedule (“MPFS”) for most imaging services. We note that certain imaging procedures, including common mammography procedures, are billed under CPT Codes with a status code “A” wherein they are reimbursed under the MPFS regardless of the site of service. The following quote from RadNet highlights the disparity between reimbursement under the MPFS and OPPS.
The [OPPS] schedule now has over a 30 percent premium relative to the [Physician] Medicare fee schedule, which makes no sense whatsoever, particularly because Medicare supposedly is interested in site neutrality with respect to its reimbursement. So as this spread widens, I think you’re going to have more and more Medicare patients, particularly ones that have a 20 percent co-pay, which is very typical in the Medicare fee-for-service landscape, start directing their business out of hospitals just like the private payors and commercial insurance plans are doing.
In our experience, these HOPD conversions are increasingly limited to markets with certain dynamics (e.g., rural markets where the number of providers/facilities are limited). While each transaction is unique and there are certainly exceptions, the markets we see HOPD conversions taking place in recently included those with lack of IDTF competition or that have one dominant health system in the market, and typically in smaller, rural markets.
![]() REGULATORY CONSIDERATIONS
REGULATORY CONSIDERATIONS
There are many regulations and legal considerations that impact the performance and valuation of IDTFs. Some of the key regulations include certificate of need (“CON”) laws, price transparency regulations, site neutral payment initiatives, and the Stark Law and federal Anti-Kickback Statute (“AKS”).
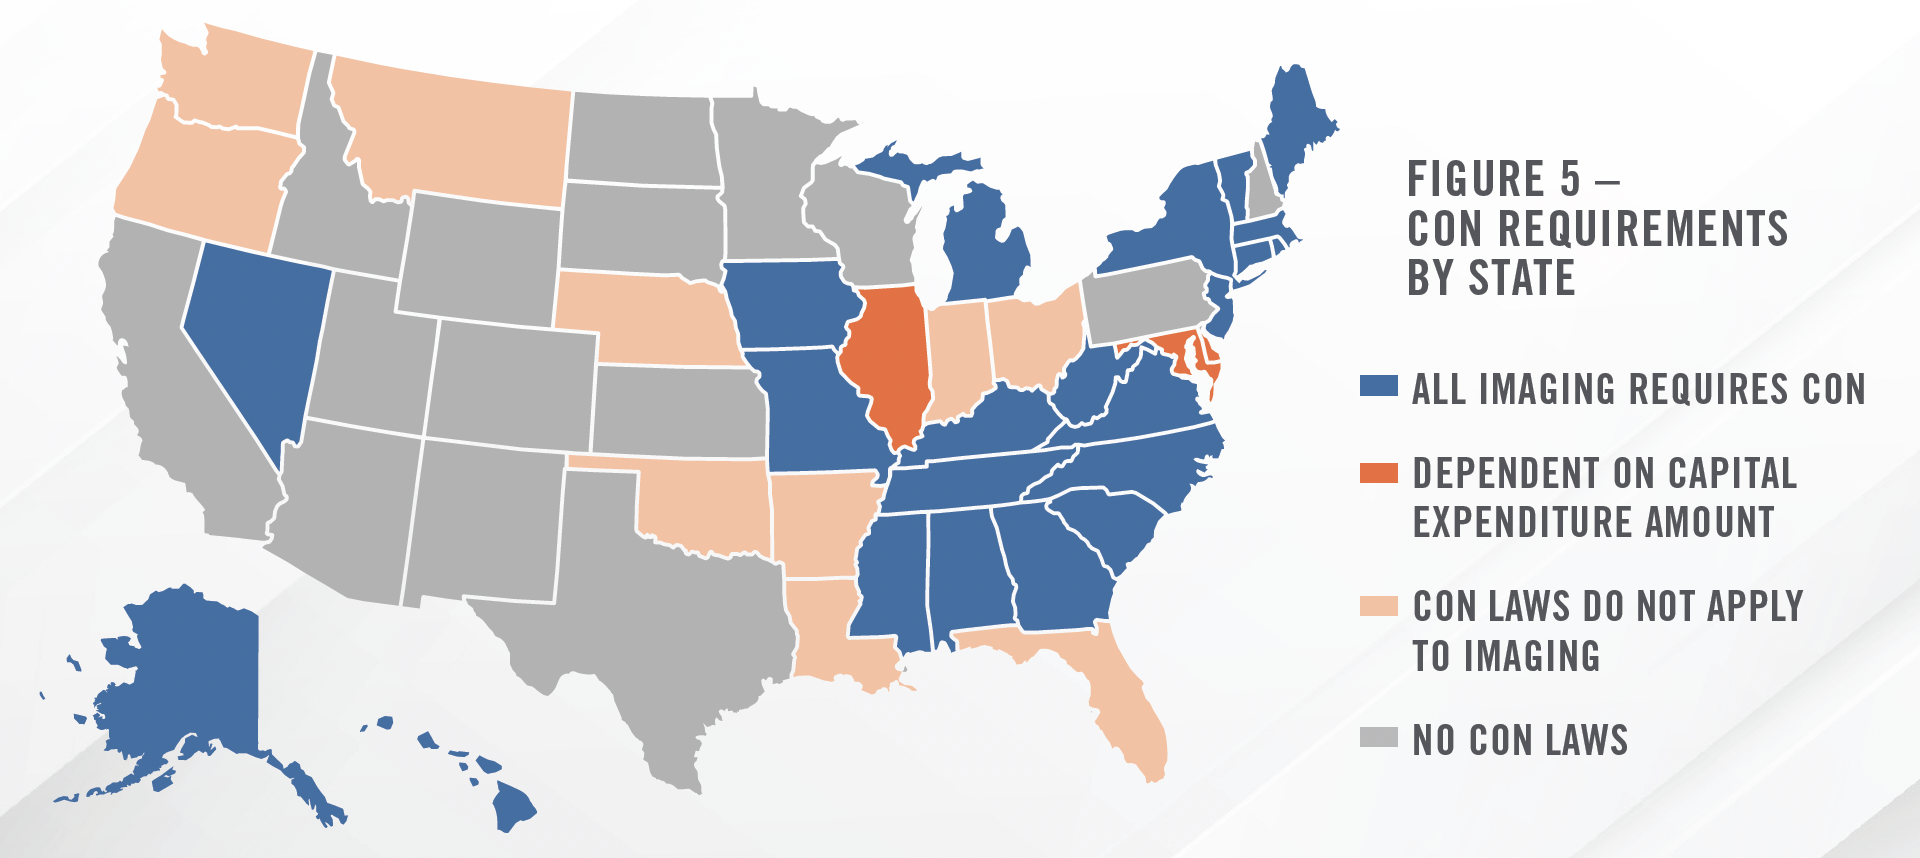
![]() Many states have CON laws that either directly pertain to imaging services or that may apply to imaging through limits on capital expenditure amounts. Figure 5 illustrates which states have CON laws that may apply to imaging centers. IDTFs in states with CON requirements may face less competition and, as a result, may command higher valuation multiples. For a deeper dive into CON regulations and how they impact value, please see HealthCare Appraisers’ FMVantage Point on the topic.
Many states have CON laws that either directly pertain to imaging services or that may apply to imaging through limits on capital expenditure amounts. Figure 5 illustrates which states have CON laws that may apply to imaging centers. IDTFs in states with CON requirements may face less competition and, as a result, may command higher valuation multiples. For a deeper dive into CON regulations and how they impact value, please see HealthCare Appraisers’ FMVantage Point on the topic.

![]()
![]()
![]()
![]()
![]()
![]()
![]()
![]()
![]()
![]()
![]()
![]()
![]()
![]()
![]()
![]() REIMBURSEMENT TRENDS
REIMBURSEMENT TRENDS
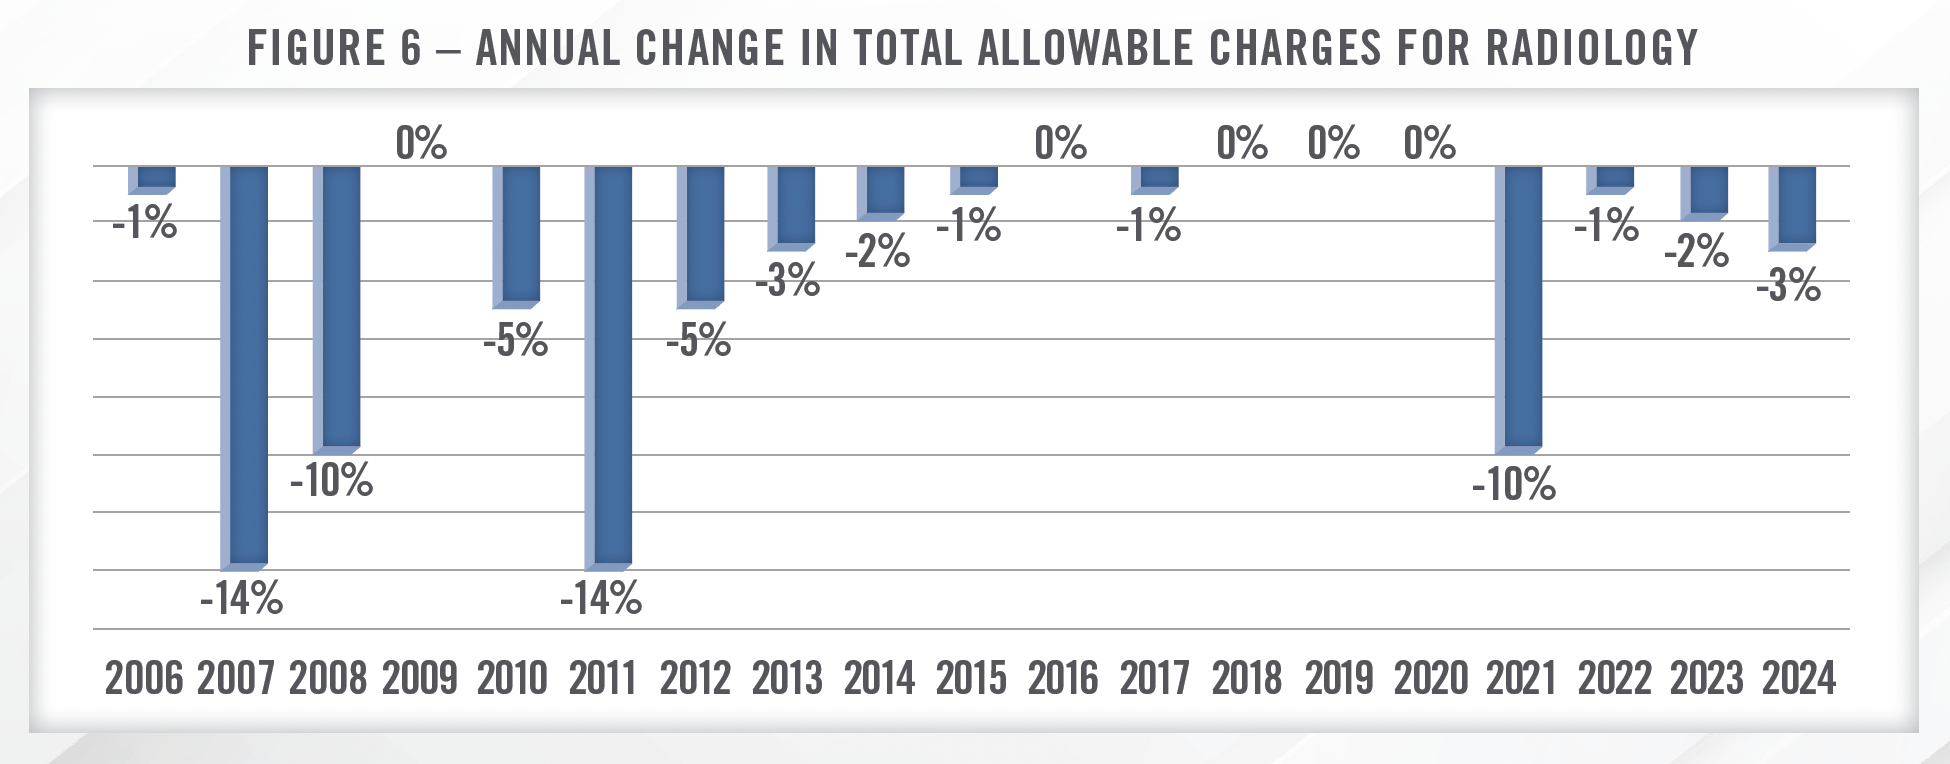
Reimbursement trends in the radiology space have been negative for some time, with CMS implementing significant cuts to total allowable charges going back nearly 20 years. Most recently, changes in reimbursement for evaluation and management (E&M) CPT codes led to material declines in reimbursement for many medical specialties that do not frequently bill E&M codes due to budget neutrality provisions, including radiology, primarily through reductions in the conversion factor. Figure 6 illustrates the annual change in total allowable charges for radiology in the MPFS final rule for each year.

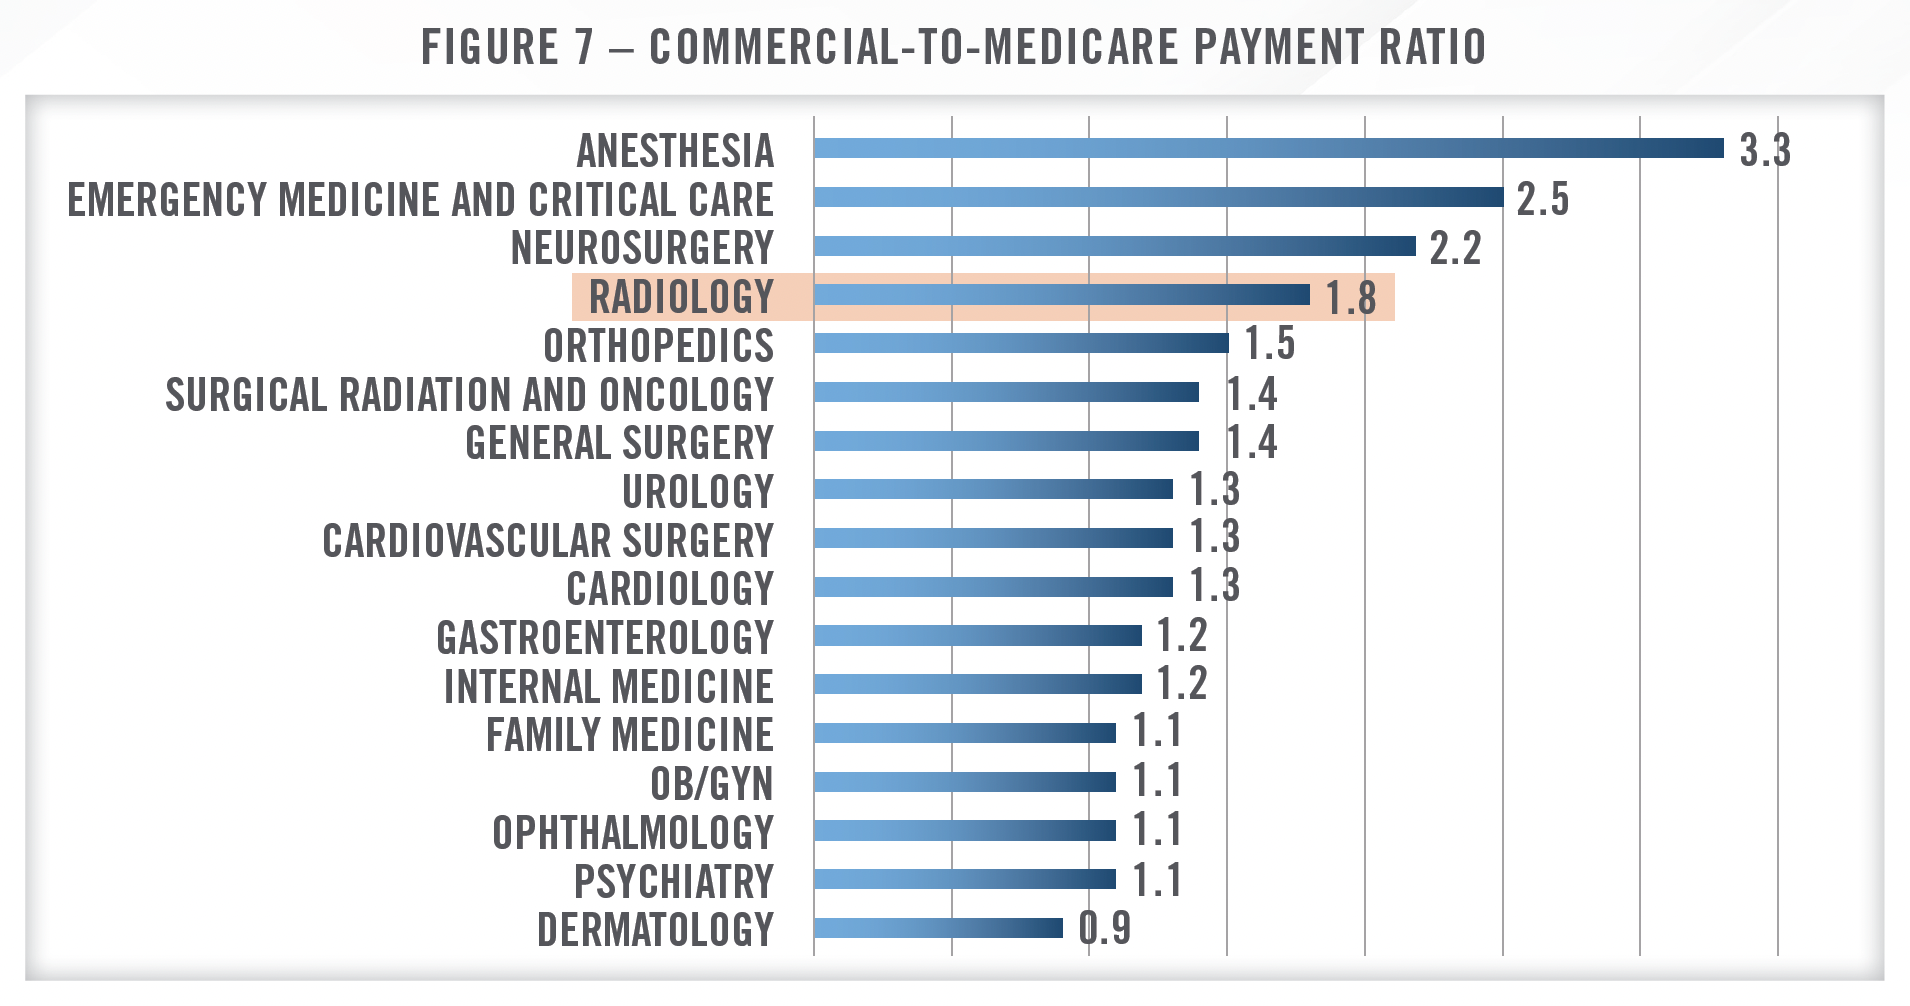
As with many other medical specialties, commercial payor reimbursement in the radiology space tends to follow Medicare, suggesting that overall commercial reimbursement rates have been declining as well. Notwithstanding, commercial reimbursement is typically higher than Medicare, and radiology tends to benefit more from this spread than many other specialties. As illustrated in Figure 7, the ratio of commercial payment to Medicare payment is 1.8x for radiology, which is among the highest analyzed in a study from the Urban Institute Health Policy Center.[12] Similarly, a study from Health Affairs found commercial rates for imaging services to be 2.4 times higher than Medicare Advantage reimbursement rates for similar services.[13]

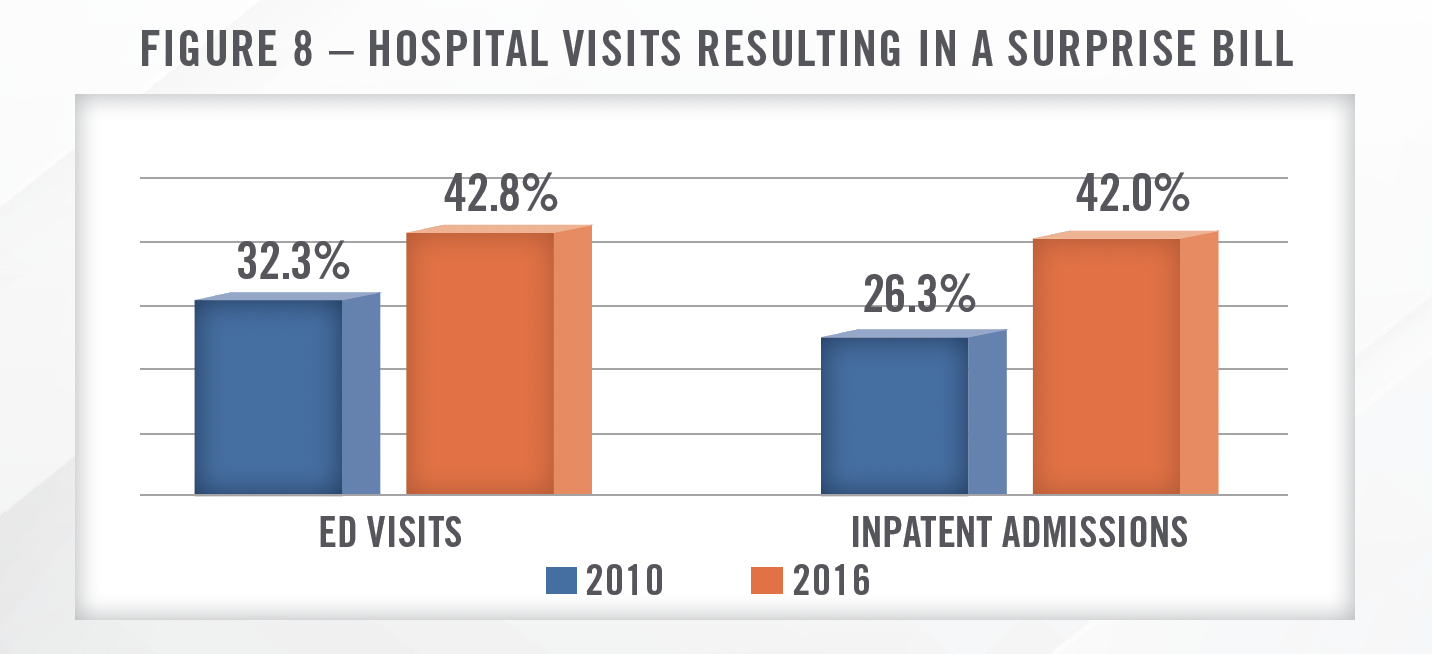
While commercial reimbursement remains above Medicare reimbursement, many physician groups, including radiology groups, have struggled when negotiating with payors since the passage of the No Surprises Act (“NSA”). In 2021, the federal government issued several regulations with the intent of curtailing surprise billing, and these rules went into effect in 2022. In the context of the hospital-based physician staffing industry, surprise billing was defined as receiving care from an out-of-network (“OON”) provider at an in-network facility. Within the text of the regulation, the government cites numerous statistics surrounding the practice of surprise billing. Figure 8 illustrates the increase in surprise billing from 2010 to 2016.[14] These surprise medical bills frequently cost patients hundreds or thousands of dollars more than if the provider had been in network, and typically don’t count toward the patients deductible or max out-of-pocket.

The NSA essentially required all providers of hospital-based physicians services, including radiology groups, to move in-network, but changed the dynamics in important ways. Without the ability to go OON with payors, physician groups lost significant negotiating leverage. This was further exacerbated by the NSA’s implementation of the Qualifying Payment Amount (“QPA”), which capped the patient’s responsibility at the median contracted rate for “like services” provided in the same geographic market. According to many large provider staffing companies, including Envision Healthcare which operates a large hospital-based radiology business, these dynamics have made it difficult to negotiate favorable rates with payors.
Now the payers have really relied on the implementation [of] the QPA, the qualified payment amount, and look at that in relationship to what the median in-network rate is…they’re utilizing what we call ghost contracting, where they’re taking all providers outside the specialty, including pediatricians, and taking those prevailing rates, which is lowering the QPA to 100% of Medicare or in some cases lower.
While the legislative policy behind the No Surprises Act is sound, the regulatory implementation of the No Surprises Act has been highly flawed, ultimately shifting the power dynamic in payment disputes too far in the favor of insurance companies (referred to as “payors”). In fact, some payors (including Envision’s single largest payor) have used the No Surprises Act and its implementing regulations as an excuse to avoid payment to medical groups like Envision and affiliated entities. Moreover, payors have aggressively denied, delayed, and reduced payment terms, often below the direct cost of delivering care. This has left Envision, other medical groups, and healthcare providers to deal with the negative financial consequences. Although the legislation included an arbitration process intended to provide a forum for providers and payors to settle disputes, the process has proved highly ineffective.
To resolve disputes between payors and providers regarding what the payment for services should be, the NSA created the Independent Dispute Resolution (“IDR”) process. The IDR is effectively an arbitration hearing in which each party to the dispute (i.e., the provider or facility and the payor) submits a proposed payment and the arbitrator selects the appropriate amount from the payments submitted by each of the two parties. While the outcomes of IDR hearings have largely been favorable to providers, with the initiating party (i.e., the provider or facility) prevailing in approximately 71 percent of disputes as of March 31, 2023, CMS has reported a significant backlog due to the high volume of disputes.[17] As a result, even when favorable rulings are achieved, the delay between the provision of services and the collection of payment has increased significantly and caused material delays in cash collections and a lengthening of the cash conversion cycle. This delay in cash receipts has contributed to deteriorating finances for many provider staffing companies, although we note that OON claims also typically take longer to collect on. CMS reported the top 10 initiating parties to IDR disputes, outlined in Figure 9.[18]
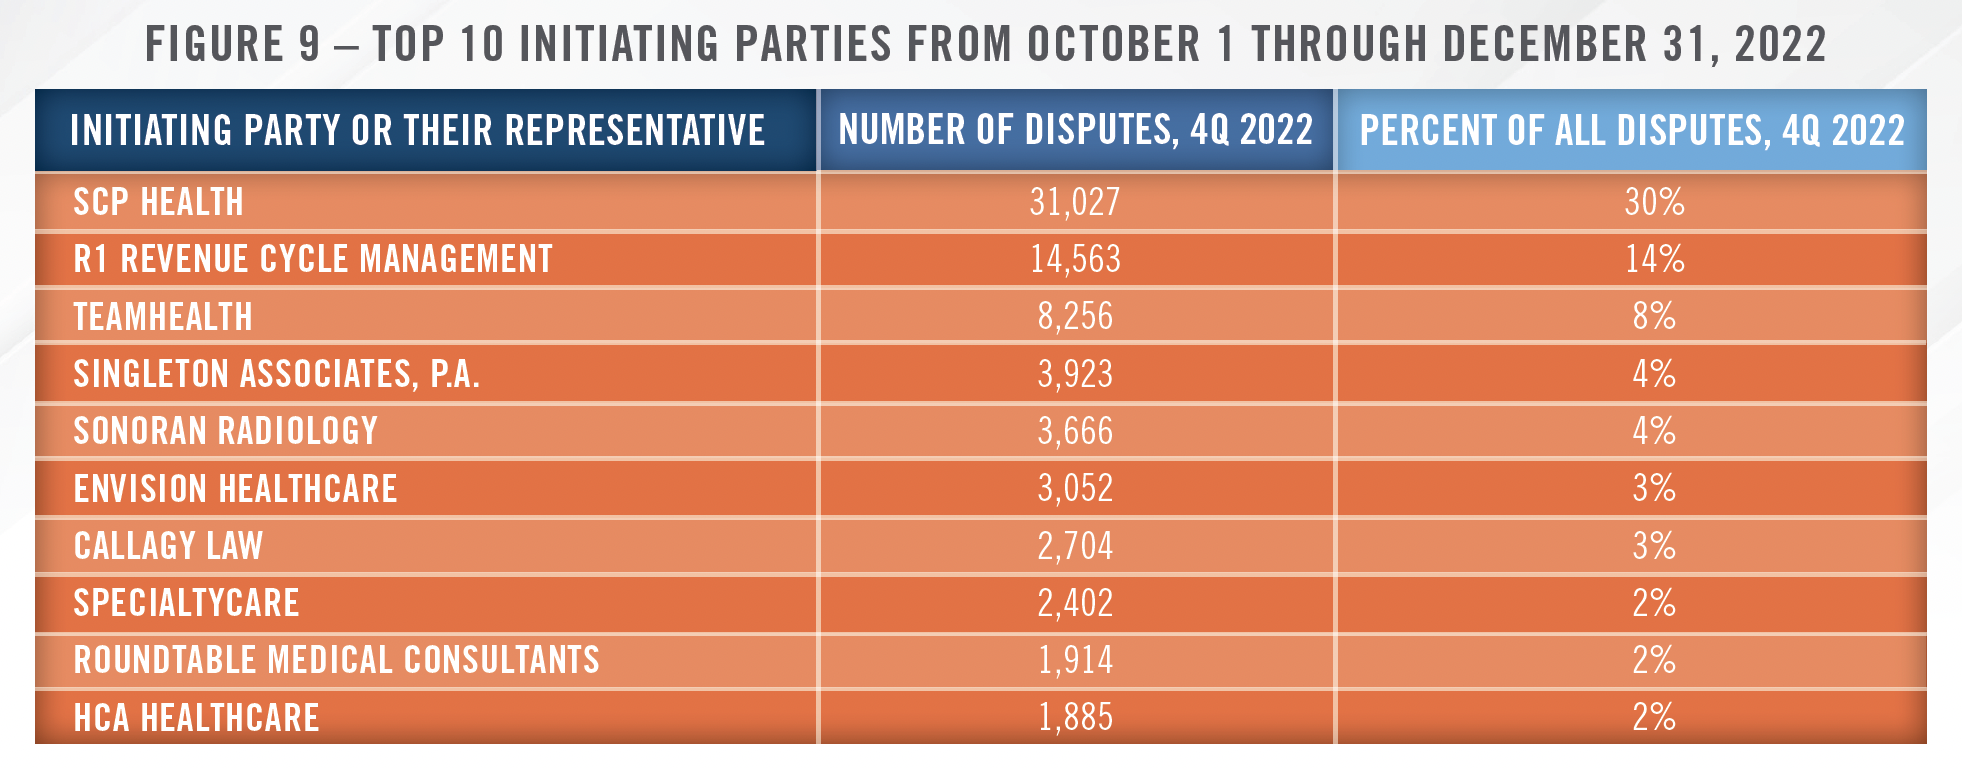

As highlighted in Figure 9, two of the largest initiating parties in IDR disputes are radiology groups. Specifically, Singleton Associates, P.A., majority owned by Radiology Partners, and Sonoran Radiology combined represent 8 percent of disputes in the time period measured. As of the date of this publication, Singleton Associates and its parent, Radiology Partners, are in active litigation over allegations of fraudulent billing practices brought by UnitedHealth Group and its Texas affiliates. HealthCare Appraisers has observed an uptick in requests for valuations of radiology support payments since the passage of the NSA, which is likely due to lower collections from professional services. For more details on how the NSA is impacting hospital-based radiology groups and the broader physician staffing industry, please see our forthcoming article on the hospital-based physician staffing industry.
As discussed earlier, the challenges related to reimbursement have been a driving force for much of the joint venture activity in the space in recent years. Independent physician groups partnering with hospitals or health systems may be able to obtain better reimbursement rates, regardless of whether the imaging center operates as an IDTF or HOPD. We have also seen imaging centers, including RadNet, enter into capitated payment arrangements in an effort to offset declining fee-for-service reimbursement.
![]() ARTIFICIAL INTELLIGENCE
ARTIFICIAL INTELLIGENCE
Operators in the radiologic imaging space have been utilizing artificial intelligence and machine learning (“AI”) to improve both clinical and non-clinical functions. On the clinical side, the use of AI to read scans has been discussed, and, to some extent, implemented for years. Although uptake may be slower than some anticipated, we have observed large practices and imaging center operators utilizing certain AI applications to assist with image interpretation, and we expect this trend to continue. The largest barrier to widespread adoption is the lack of reimbursement for utilizing these technologies. We have worked with companies that develop AI in the imaging space, and while the technology has demonstrated benefits with respect to earlier detection and accurate interpretations, there is no incremental revenue associated with practices deploying the technology. Therefore, for the most part, these technologies represent an added cost but no additional revenue. This same issue was discussed by RadNet on a recent earnings call.
We’re going direct to consumer since there is no reimbursement for AI at this point in time. This is a different strategy than almost anything that we’ve attempted in the past, although our prior effort in this was also successful from eight years ago, I think it was when 2D mammography got converted to 3D mammography. And we had a similar process that we implemented to have patients pay for this before it was reimbursed. We expect a similar process to unfold here so that the direct-toconsumer we hope is just a stopgap until it’s adopted by not only more and more of the payors, but more and more employers, as well.
As alluded to in the RadNet quote, their primary approach to generating revenue from AI is educating patients on the benefits of using AI, which typically has the ability to catch certain issues that present on a scan before a human radiologist is able to identify it. For example, the company offers its Enhanced Breast Cancer Detection service, which has demonstrated the ability to detect and diagnose breast cancer up to two years earlier than the human eye. At a recent conference, the company indicated this product has a 35 percent adoption rate on the east coast, and was recently rolled out on the west coast. Patients pay $40 out of pocket to receive this service as part of their annual screenings. Over time, the demonstrated ability to detect and diagnose problems earlier should lead to more widespread reimbursement from CMS and private payors, particularly as value-based care models continue to gain traction.


On the non-clinical side, operators are implementing generative AI to perform back-office functions more efficiently. This is certainly not limited to the radiology space, but recent quotes from RadNet shine a light on the potential for this technology to improve administrative efficiency and increase profit margins.
Currently, we rely on manual processes to perform functions that can be more accurately and [efficiently] completed with artificial intelligence. We see a future where patients and referring physicians will be able to schedule appointments, be able to verify patient insurance coverage, be able to request radiology reports and images, receive billing and payment information and pay outstanding balances amongst other things, with significant reduction in manual intervention.
![]() TRANSACTION LANDSCAPE
TRANSACTION LANDSCAPE
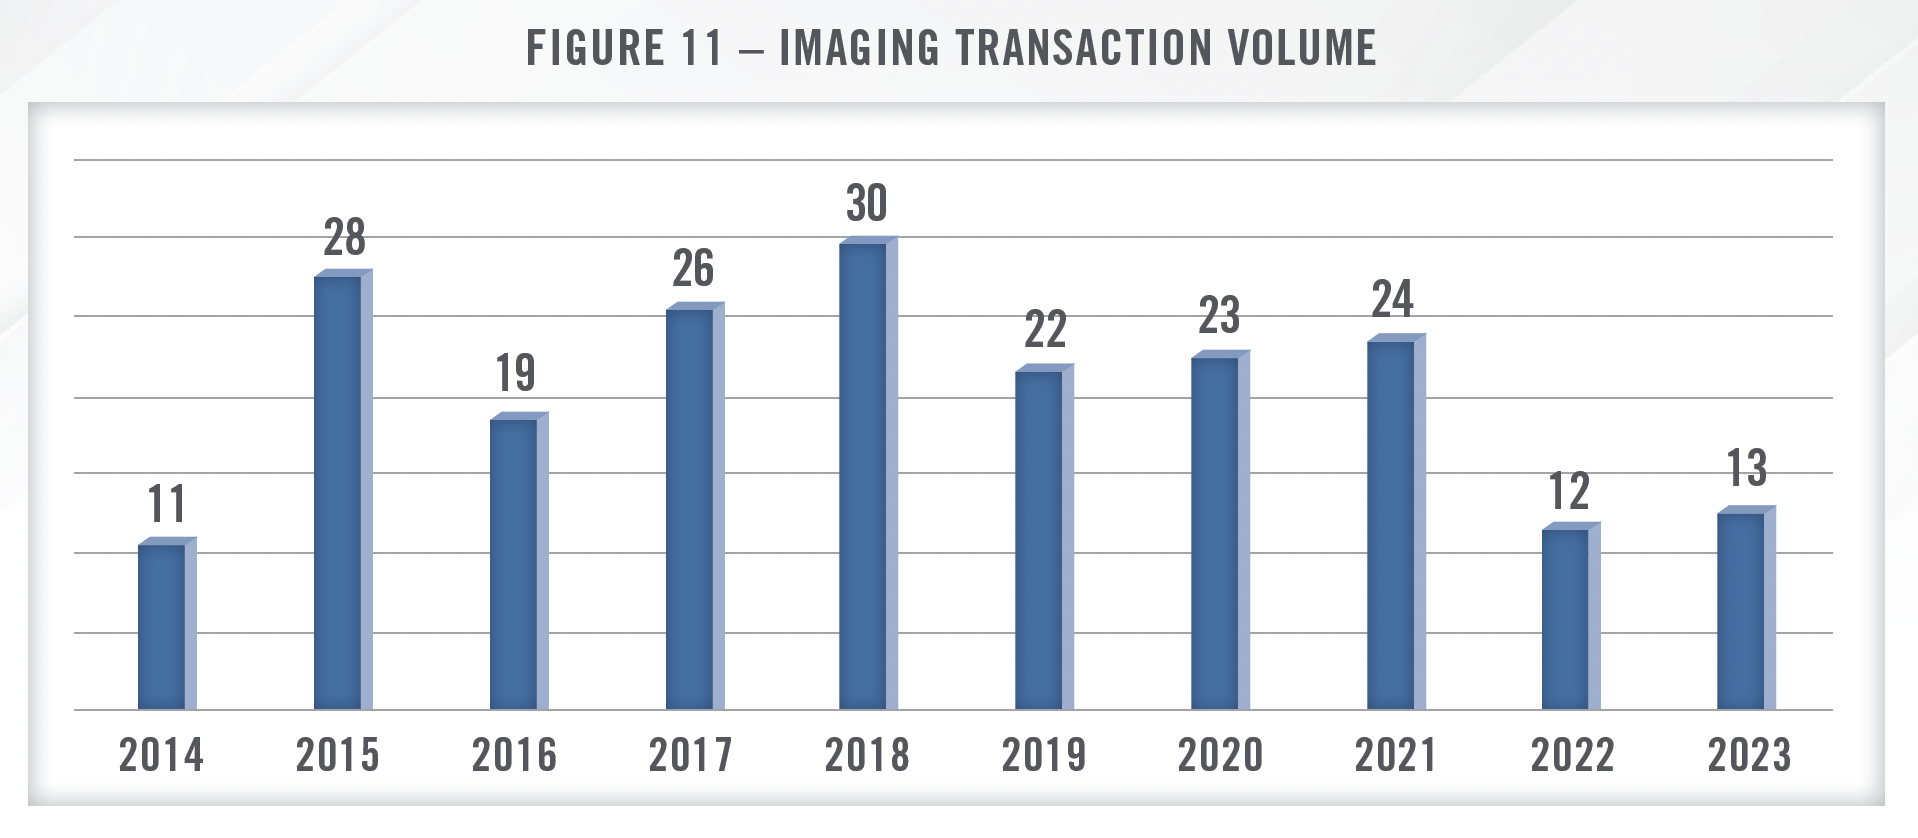
Transaction activity in the radiology space was robust for several years before cooling off in 2022. This is consistent with the broader healthcare M&A landscape as higher interest rates and economic uncertainty started to impact deal volume in 2022, which continues into 2024. Despite the slower M&A environment, for many of the reasons discussed herein, hospitals remain interested in acquiring ownership in imaging centers, frequently through joint venture arrangements. Private equity sponsors have also been active in acquiring radiology practices due to the fragmented market and the benefits of scale. Figure 11 presents merger and acquisition volume in the radiology space over the last several years. As of the date of this publication, transaction data from 2023 may not be complete as not all sources have reported full year transaction activity.

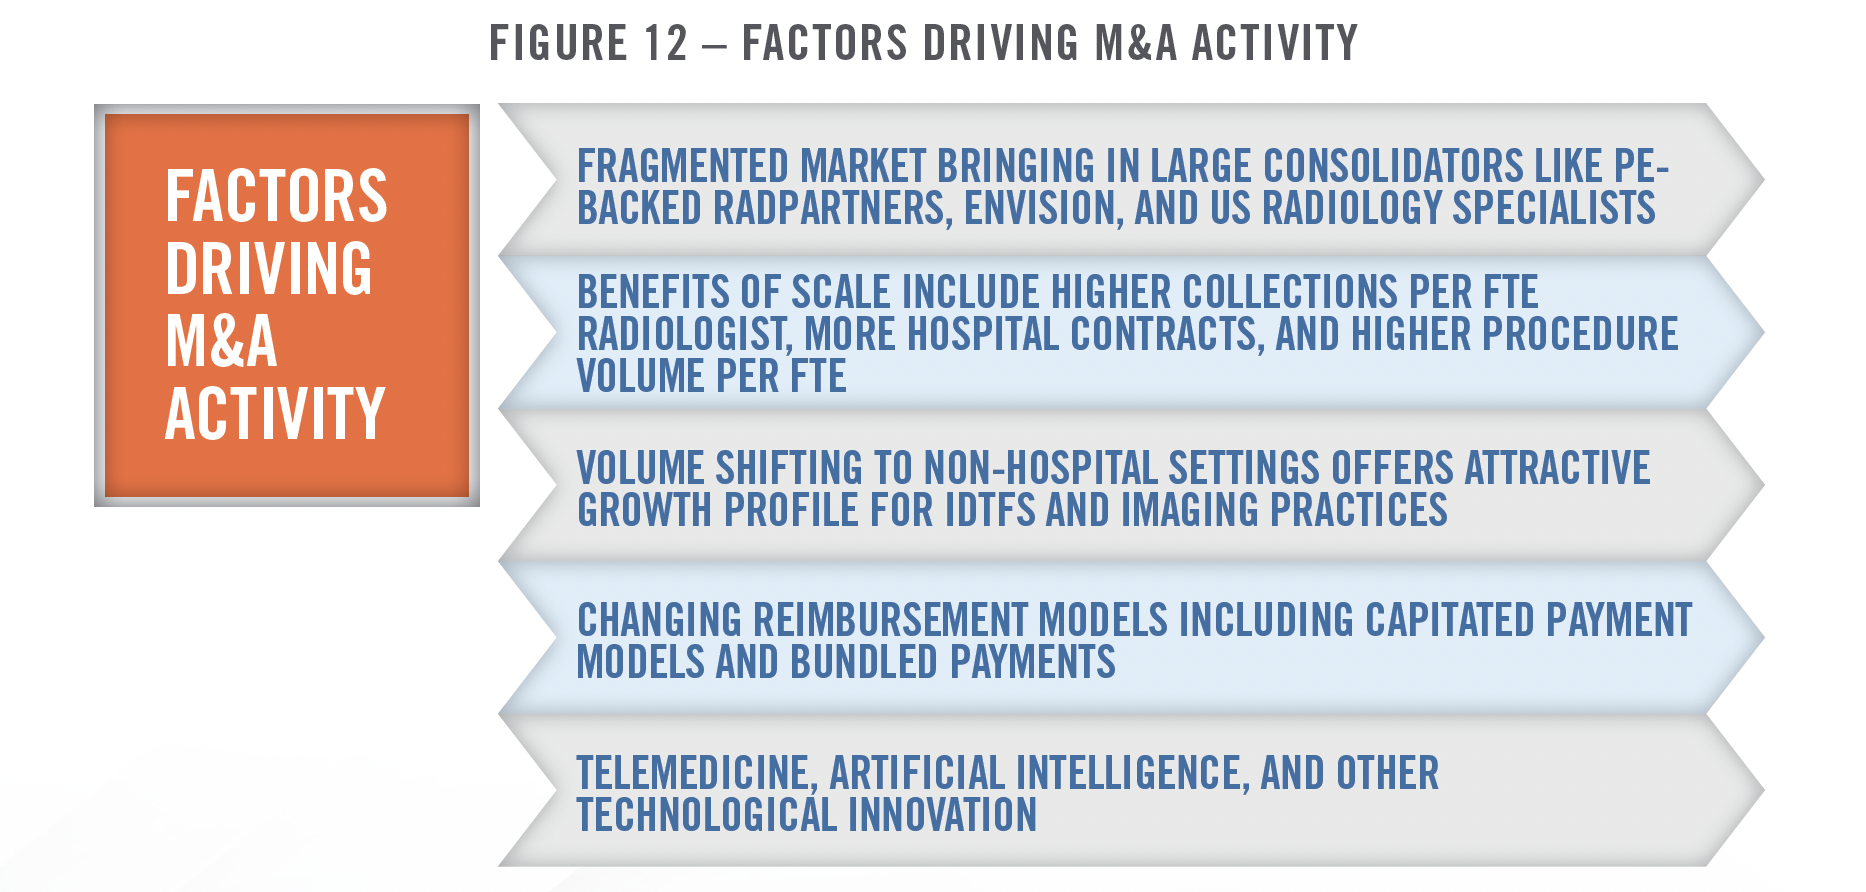
There are many factors that make the radiology market an attractive sector for acquirers. Radiology practices and IDTFs remain highly fragmented, and there are many benefits to scale. Figure 12 outlines some of the key factors that have contributed to interest in the radiology industry in recent years.

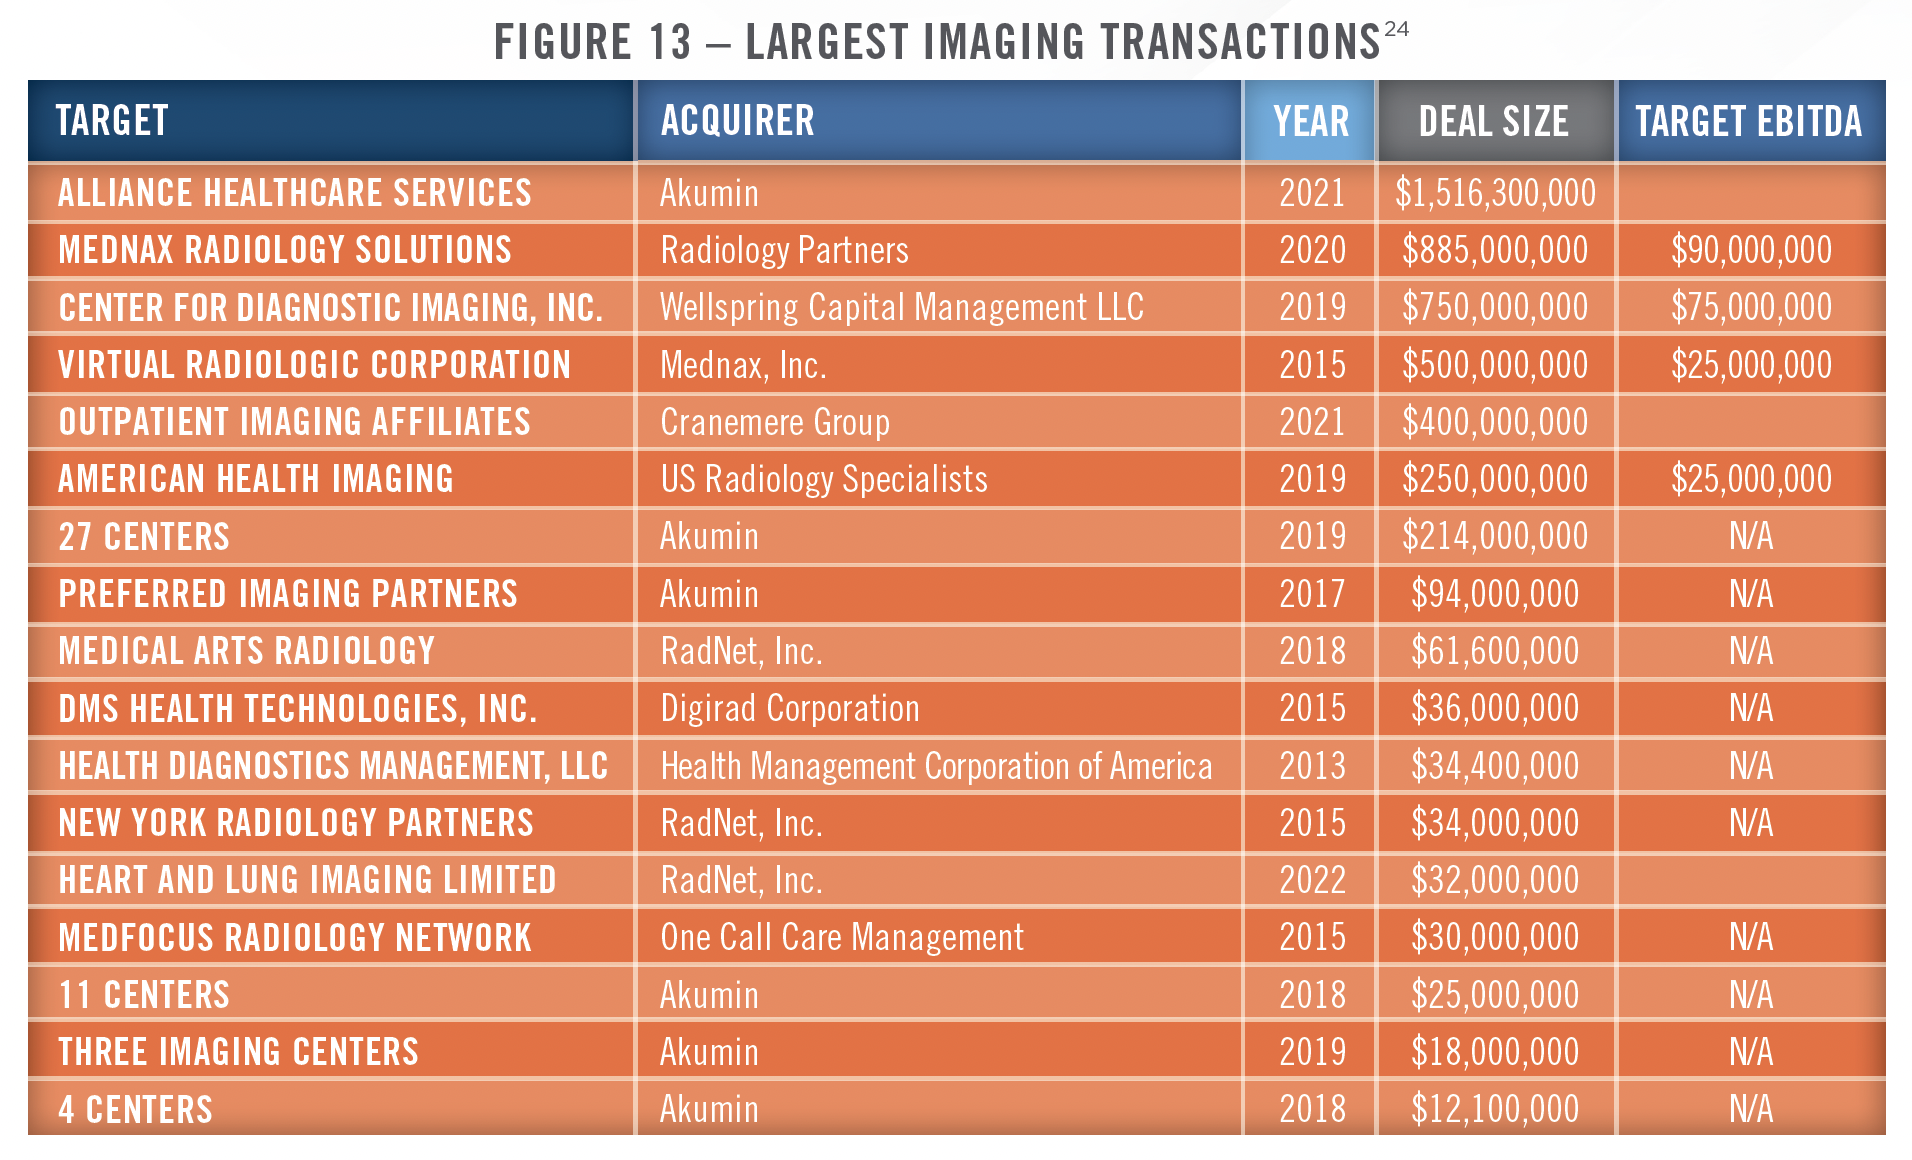
While the industry remains highly fragmented, there have been some large deals in recent years, and several private equity-backed organizations, along with publicly traded operators, are starting to reach considerable scale. RadNet, Inc. is the largest provider focused solely on outpatient imaging services in the country with 366 imaging centers as of September 30, 2023. Akumin, which filed for bankruptcy protection in October of 2023, owned or operated 180 centers and provided services to approximately 1,100 hospitals and health systems in 48 states as of its bankruptcy filing date. Per the bankruptcy agreement, the company will continue to operate under new ownership by its major lenders. Envision Healthcare, which has a significant hospital-based radiology segment, also filed for bankruptcy in May of 2023. Radiology Partners (RadPartners) is the largest radiology physician practice management company in the country, with more than 3,300 radiologists across all 50 states. RadPartners serves more than 3,250 hospitals and healthcare facilities, and has grown primarily through practice acquisitions. The company was recently downgraded by S&P credit ratings due to its significant debt burden. US Radiology Specialists is another large private-equity backed physician practice management company with more than 400 providers, 180 IDTFs, and more than $800 million in revenue. Outpatient Imaging Affiliates (OIA) is headquartered in Nashville, Tennessee and owns and operates IDTFs, many in joint venture arrangement with hospitals. OIA was acquired by Cranemere Group in a transaction valuing the business at $400 million in October of 2021.
As illustrated in Figure 12, there are many benefits to scale in the radiology sector, with larger practices experiencing higher revenue per FTE radiologist, greater hospital contracts per group, and more procedures per FTE physician than smaller practices.[23] Some of the largest radiology transactions in recent years are presented in Figure 13. Mednax, Inc. sold its radiology business, which was one of the largest in the country with approximately $550 million in revenue and $90 million in EBITDA, to RadPartners in 2020, while Akumina acquired Alliance Health Services in 2021.

Another important factor driving consolidation in the imaging sector is the growth of value-based payment models, which are more easily implemented by larger groups with access to technological and financial resources. Examples of value-based payment models in the imaging space include capitated payment arrangements whereby radiology groups and/or imaging centers receive a per member, per month (“PMPM”) payment to provide a population with imaging tests. One such arrangement exists between RadNet and EmblemHealth, in which RadNet receives the PMPM payment to manage the outpatient imaging needs of certain EmblemHealth members. Radiology groups can also participate in bundled payments, particularly certain types of surgical procedure bundles involving orthopedic surgery or other specialties where diagnostic imaging is a component of the episode of care.
![]() VALUATION AND OUTLOOK
VALUATION AND OUTLOOK
Despite some of the headwinds discussed herein such as the challenging reimbursement environment, we expect continued transaction interest in the space, particularly from health systems looking to form joint ventures and private equity groups. Several factors point toward positive growth in the industry, including the strong healthcare utilization trends which emerged in 2023. IBISWorld estimates 2.4 percent annual revenue growth for the industry from 2023 through 2028[25], and analysts covering RadNet forecast revenue growth and margin expansion through 2025.[26] As noted earlier, RadNet is expanding capacity to meet the strong demand it is experiencing in its markets. Analyst estimates for RadNet’s future financial performance are presented in Figure 14.


As discussed earlier, valuations throughout the healthcare industry have come down from the high levels of 2021, which is helping to bring certain buyers back into the market. RadNet has discussed how competition from private equity firms willing to pay double digit multiples has kept it out of the market in recent years. The company has previously indicated that it pays mid-single digit valuation multiples for smaller acquisitions in its local markets, which is similar to what we typically observe in the space. Now that multiples have come down, the company may be more active in its M&A strategy. RadNet’s enterprise value to trailing 12-month EBITDA multiples are presented in the figure below.


We believe 2024 and beyond will represent a continuation of many of themes discussed herein. Volumes are expected to continue to shift to non-hospital settings, which will likely drive increased interest in joint venture activity between hospitals and radiology groups. AI will become a larger component of radiology groups with scale on both the clinical and administrative side of the business. We also see additional opportunities for radiology providers to participate in various value-based care arrangements including bundled payments and capitated models. Much of the advisory work HealthCare Appraisers provides in the radiology space involves structuring joint ventures between imaging center operators, physician groups, and hospitals or health systems. Within this space, we are frequently asked to value asset contributions, perform rate lift (black-box) analyses, develop proformas, provide market assessments, and work with providers to enhance operations through benchmarking and compensation plan analyses. As mentioned earlier, we also work closely with hospitals and hospital-based radiology groups to assess appropriate levels of staffing and evaluate RFPs for clinical coverage. HealthCare Appraisers has the experience and insight to provide the necessary advisory and consulting services to meet the needs of your organization in this ever changing market.
CONTACT THE EXPERTS AT HEALTHCARE APPRAISERS TO DISCUSS YOUR ADVISORY AND VALUATION NEEDS REGARDING DIAGNOSTIC IMAGING CENTERS AND RADIOLOGY PRACTICES
[1] RadNet, Inc. Earnings Call on November 9, 2023
[2] RadNet, Inc. Investor Presentation; Accessed January 2, 2024
[3] IBISWorld Reports; Accessed January 2, 2024
[4] Ibid 1
[5] Advisory Board; Scrutiny over hospital imaging prices continues: How you should respond to UHC’s new policy; https://www.advisory.com/research/imaging-performance-partnership/the-reading-room/2018/10/uhc-imaging-policy Accessed January 2, 2024
[6] Health Affairs; https://www.healthaffairs.org/doi/full/10.1377/hlthaff.2014.0168 Accessed January 2, 2024
[7] State Health Compare; https://statehealthcompare.shadac.org/Data; Accessed January 2, 2024
[8] RadNet, Inc. Earnings Call on August 8, 2023
[9] This 40 percent rate is related to services implicated by the site neutral provisions, while the 30 percent referenced in the RadNet quote earlier pertains to all imaging services.
[10] Advisory Board; https://www.advisory.com/blog/2018/08/site-neutral#:%7E:text=Here%E2%80%99s%20 Accessed January 3, 2024
[11] HealthcareDive; https://www.healthcaredive.com/news/anthem-will-no-longer-pay-hospitals-for-outpatient-mris-ct-scans/503706/ Accessed January 3, 2024
[12] Urban Institute; https://www.urban.org/sites/default/files/publication/104945/commercial-health-insurance-markups-over-medicare-prices-forphysician- services-vary-widely-by-specialty_0.pdf, Accessed January 10, 2024
[13] Health Affairs; https://www.healthaffairs.org/doi/10.1377/hlthaff.2023.00039, Accessed January 10, 2024
[14] Federal Register.gov, https://www.federalregister.gov/documents/2021/07/13/2021-14379/requirements-related-to-surprise-billing-part-i, Accessed October 5, 2023
[15] Pediatrix Medical Group Investor Presentation on May 9, 2023
[16] https://restructuring.ra.kroll.com/Envision/; Disclosure Statement for the Joint Chapter 11 Plan of Reorganization of the EVPS Debtors; Last Accessed January 25, 2024
[17] CMS.gov, https://www.cms.gov/files/document/federal-idr-processstatus-update-april-2023.pdf, Accessed October 5, 2023
[18] CMS.gov, https://www.cms.gov/files/document/partial-report-idr-process-octoberdecember-2022.pdf, Accessed October 5, 2023
[19] United States District Court Central District of California; https://storage.courtlistener.com/recap/gov.uscourts.cacd.881502/gov.uscourts. cacd.881502.1.0.pdf; Accessed January 11, 2024
[20] Ibid 8
[21] Ibid 8
[22] LevinPro HC, Levin Associates, 2024, January, levinassociates.com , S&P Capital IQ, Company Filings. May not represent complete data on all transactions.
[23] Radiology Business; https://www.radiologybusiness.com/sponsored/1077/topics/leadership/100-largest-private-radiology-practices Accessed January 11, 2024
[24] Irving Levin, S&P Capital IQ, and other publicly available resources
[25] Ibid 2
[26] S&P Capital IQ
[27] Ibid 19

