Authors: David Y. Lo, CFA, ASA and Nicholas J. Janiga, ASA

The physical therapy industry continues to see growing activity and investment. Most recently ATI Physical Therapy went public through a merger with a special purpose acquisition company, Fortress Value Acquisition Corp II, which valued the combined company at $2.5 billion. In addition to discussion of recent market activity, this article provides background information on the physical therapy industry, and provides insight into what is driving the increased interest from healthcare providers and investors. We also discuss the outlook for the physical therapy industry, including how telehealth and recently implemented reimbursement models are affecting the landscape. Finally, we discuss the approaches to value and how they are applied to physical therapy business valuations.
![]() BACKGROUND
BACKGROUND
Physical therapy involves the provision of clinical services designed to promote mobility, reduce pain, restore function and prevent disability for individuals who have suffered some type of acute physical trauma, or for individuals with diseases or disorders that limit mobility. Physical therapy is provided in a variety of settings including outpatient clinics/offices, acute care hospitals, inpatient rehabilitation facilities, long-term care facilities, athletic facilities, the workplace, and at home. Medicare payment distribution by care setting is outlined in Figure 1. Physical therapists (PTs) are licensed medical professionals that have earned a Doctor of Physical Therapy degree and passed a national exam. Under the supervision of a physical therapist, rehabilitative care can also be provided by physical therapy assistants (PTAs). Most states require PTAs to pass a national licensure examination before practicing. Physical therapy is a sub-sector of the broader outpatient rehabilitation market, which also includes occupational therapy and speech-language pathology.
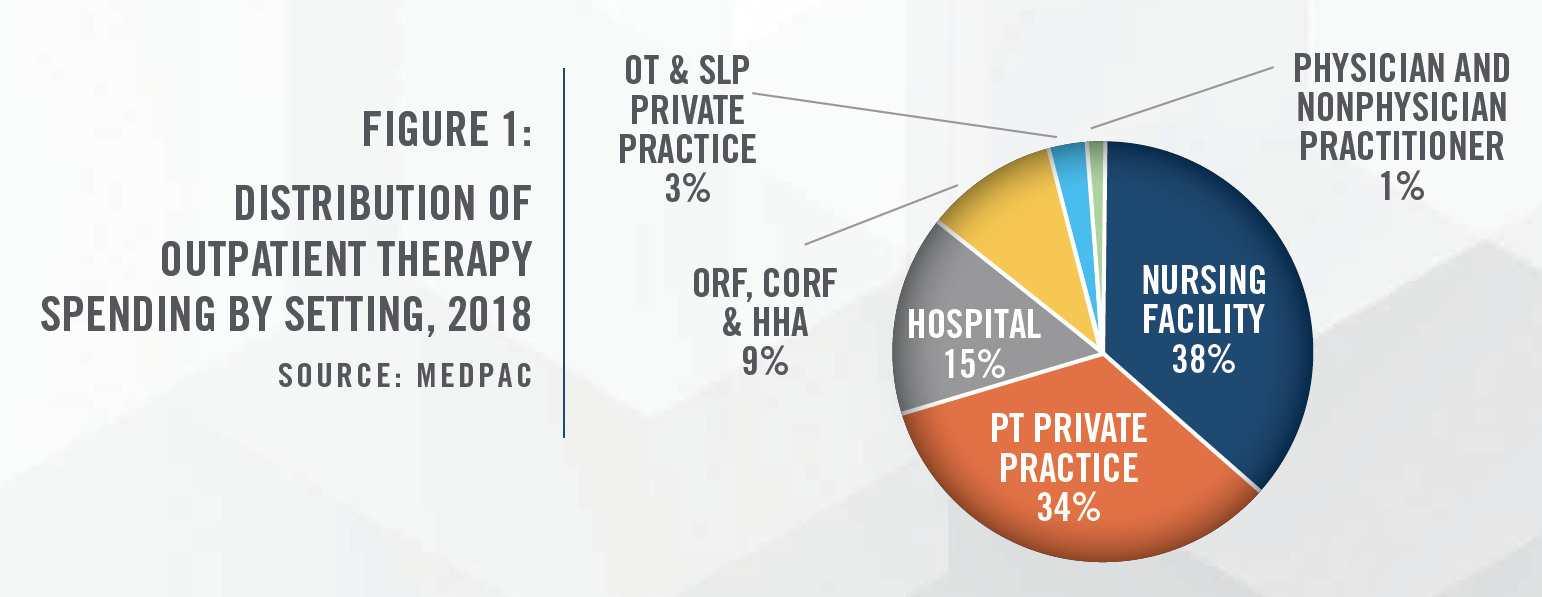

Estimates of the size of the United States physical therapy market range up to $38 billion, with growth rates in the coming years projected to be in the mid-single digits.[1] According to MedPAC, Medicare spent $8.7 billion on outpatient therapy services in 2018, which represents an 8 percent increase from 2017 spending.[2] Many tailwinds support the physical therapy industry, including an aging population, earlier discharges from hospitals, a growing interest in physical activities, finding safe alternatives to opioids, and high rates of obesity. In addition, the continued shift from inpatient to outpatient care settings, use of telehealth/teletherapy, and the broader focus on controlling healthcare costs in the United States, is helping drive physical therapy patient volume. The steady growth as well as the fragmented nature of the market has led to an uptick in investor interest in the space. While there are many positive trends for the physical therapy industry, expected cuts to Medicare reimbursement is a headwind for the industry.
![]()
![]()
![]()
![]()
![]()
![]()
![]()
![]()
Physical therapists commonly perform procedures in the 97000 CPT Code range of the Medicare Physician Fee Schedule, which is where physical medicine and rehabilitation CPT Codes are located. Some of these CPT Codes are time-based, typically billed in 15-minute increments, and others are service-based, billed once when the service is provided. Many physical therapy clinics contract with private payors on a per visit basis, with set reimbursement rates per visit.
The 2021 Physician Fee Schedule Final Rule and the subsequent Consolidated Appropriations Act of 2021 reduced the Medicare conversion factor from $36.09 to $34.89. Despite CMS revaluing certain physical therapy evaluation and behavioral healthcare services that contained similar types of work to office/outpatient E&M visits, Physical/Occupational Therapy was projected to incur a 9 percent decline in reimbursement. As a result of certain provisions in the Consolidated Appropriations Act of 2021, the projected reimbursement cuts are expected to be less at approximately a 3.6 percent decline. According to the American Physical Therapy Association, this is a result of: 1) a $3 billion infusion that gives CMS more money in 2021 to offset a boost to evaluation and management visit codes while maintaining budget neutrality; and 2) a three-year delay in the implementation of an add-on CPT Code (i.e., G2211) to reflect the additional complexity of a visit and receive additional payment. The delay in implementing this add-on CPT Code makes an additional $3 billion available in Medicare Physician Fee Schedule payments.
The 2020 final rule[3] implemented the requirement that a PTA modifier be placed on certain claims starting January 1, 2020. Beginning January 1, 2022, Medicare will reimburse outpatient therapy services performed by PTAs at 85 percent of the otherwise applicable payment amount.[4] This will have a material impact on the physical therapy industry and will likely put financial pressure on many providers, including those in rural and underserved areas.
Physical therapy reimbursement will also experience a change with the Medicare Merit-Based Incentive Payment Plan (MIPS) introduced in 2019. MIPS assesses a provider’s services based on Quality, Improvement Activities, Promoting Interoperability and Cost. This is especially important as more than a third (see Figure 2) of the physical therapy industry’s revenue comes from government payers. Some physical therapists in private practice are required to participate in MIPS, while others are able to do so by choice. Participation is dictated based on how many of the “low-volume” thresholds are exceeded, a depiction of which is illustrated in Figure 3.
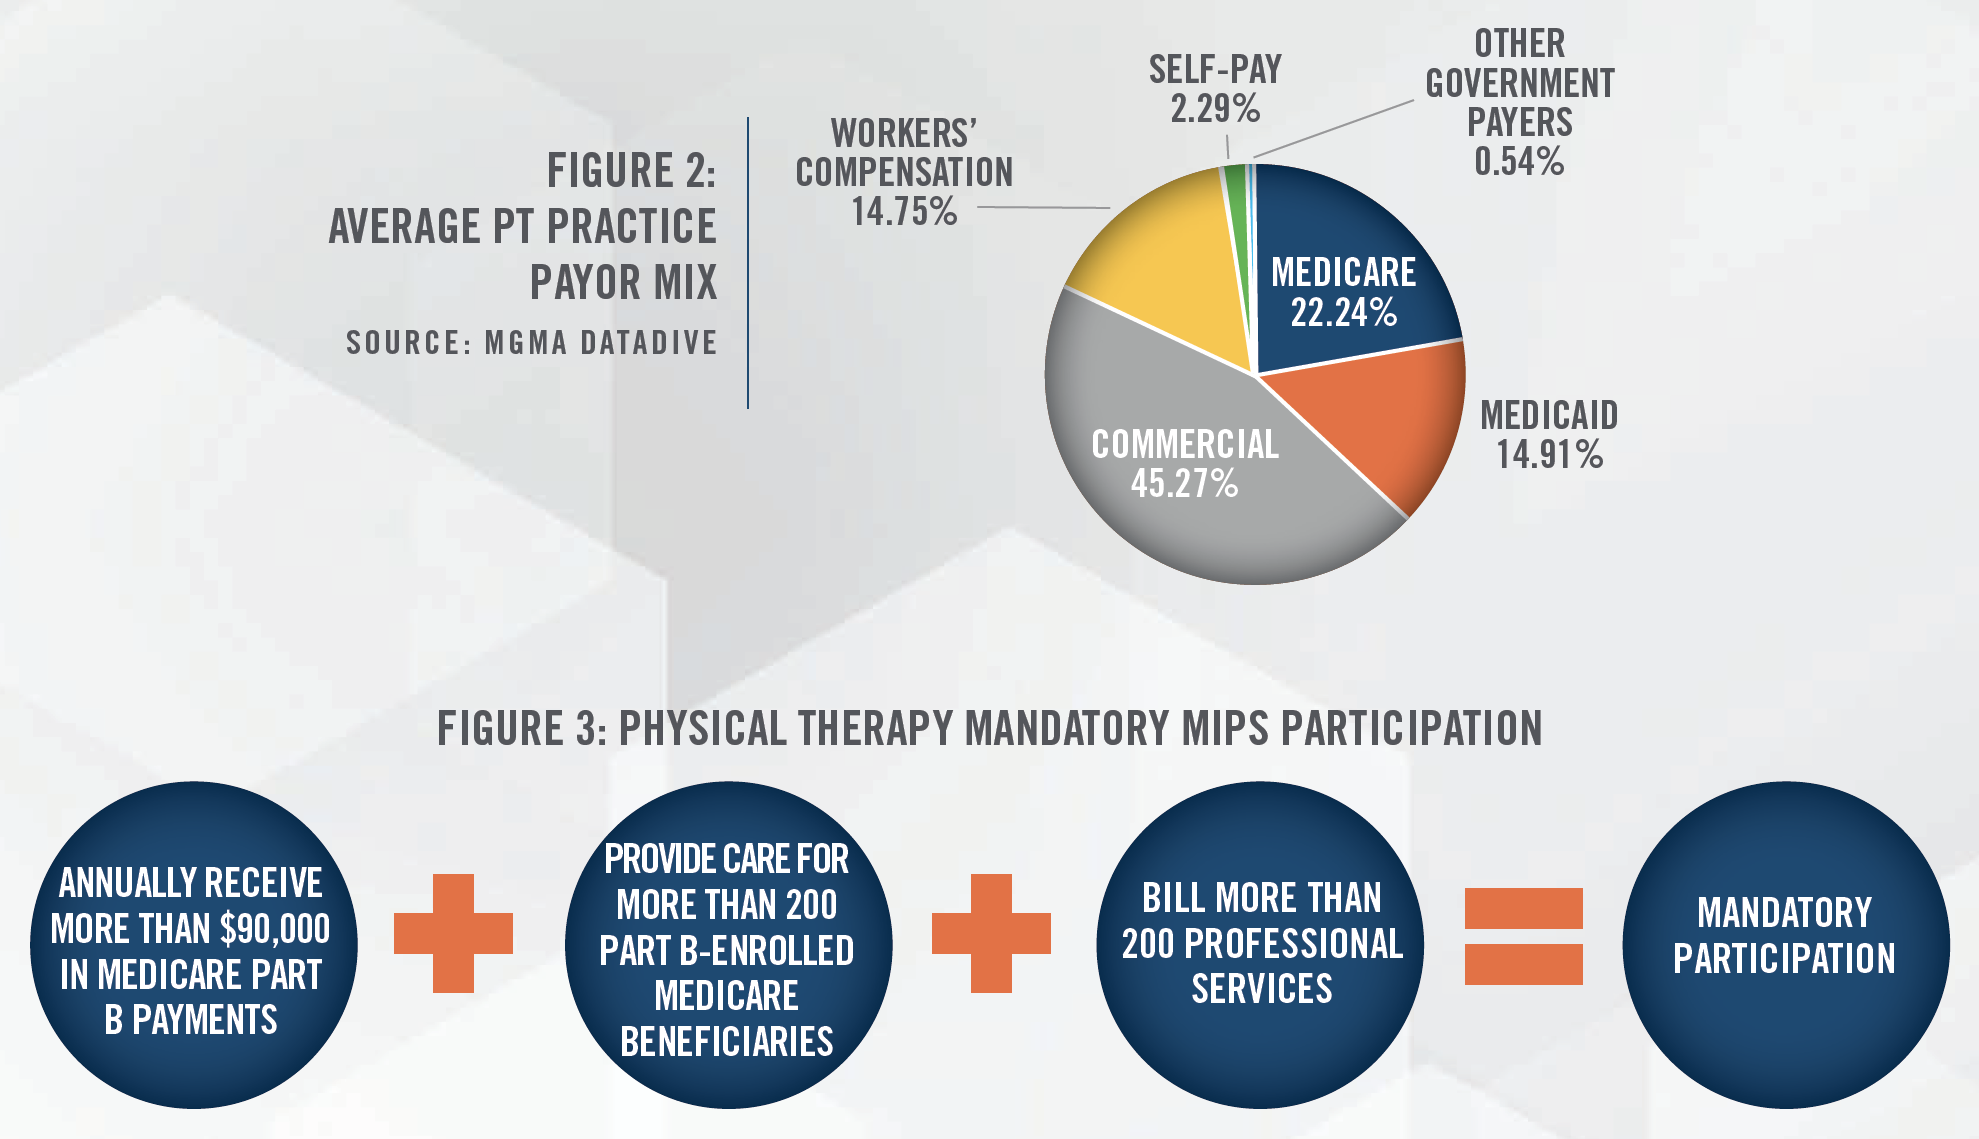

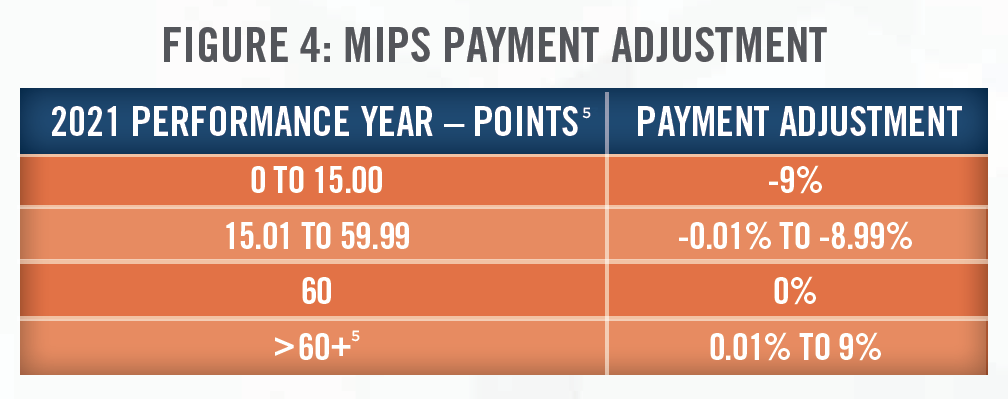
Figure 4 outlines the MIPS payment adjustments for the 2021 performance year, which will impact Medicare payments in 2022. It is expected that more physical therapy clinics will participate in MIPS in order to offset the expected reimbursement cuts in coming years. With the continued reimbursement pressures and potential restrictions placed on their services by third-party payors, the cost of collecting payment from third-party payors, and the difficulties in negotiating rates with insurance companies, some physical therapists are choosing an out-of-network or cash-only model for their practices.

Prior to COVID-19, physical therapy services delivered through telehealth were not payable under the Medicare Physician Fee Schedule. CMS broadened access to Medicare telehealth services under the 1135 waiver[6] which allowed physical therapists to bill for online assessment and management services using HCPCS Codes G2061, G2062, and G2063. As of January 1, 2021, CMS permanently allows PTs to render e-visits which are now billed using CPT Codes 98970, 98971, and 98972. The use of telehealth in the physical therapy industry is expected to grow as commercial payors have started providing reimbursement for these services.
The use of telehealth in the physical therapy space has led to an increase in related acquisition activity. In May 2020, Omada Health, a digital health company offering programs for chronic disease prevention and management and mental health support serves, acquired Physera Health, a digital health company offering remote physical therapy solutions to patients, for $30 million. With the acquisition of Physera, Omada is able to provide its patients with video appointments with licensed physical therapists, and access to app-guided exercises and personalized recovery plans. Meanwhile, Hinge Health, a startup offering patients virtual physical therapy through methods such as health coach guided physical therapy sessions monitored by sensors, raised $300 million in funding.[7]
![]()
![]()
![]()
![]()
![]()
![]()
![]()
![]()
Effective January 1, 2018, the Bipartisan Budget Act of 2018 permanently repealed the payment caps on annual per beneficiary spending for physical therapy services. The caps were previously put in place to help constrain excess spending and use. Going forward, providers will still have to certify that services are medically necessary when the annual per beneficiary spending reaches $2,110 for 2021.
In 2018, the OIG reviewed 300 claims in a stratified random sample and found that 61 percent of Medicare claims did not comply with Medicare medical necessity requirements, and estimated that Medicare could have saved $367 million on services provided by outpatient physical therapists from July 1 through December 31, 2013. It is expected that CMS will attempt to better monitor the appropriateness and necessity of outpatient physical therapy claims going forward.
![]()
![]()
![]()
![]()
![]()
![]()
![]()
![]()
Despite negative reimbursement trends, there are several tailwinds for the physical therapy industry, including an aging population, earlier discharges from hospitals, finding safe alternatives to opioids, and high rates of obesity.
![]()
![]()
![]()
![]()
![]()
![]()
![]()
![]()
![]()
![]()
![]()
![]()
![]()
![]()
![]()
![]()
![]()
![]()
![]()
![]()
All of these trends have led to a strong job outlook for PTs and PTAs, which are expected to increase by 18 percent and 29 percent, respectively, between 2019 and 2029.
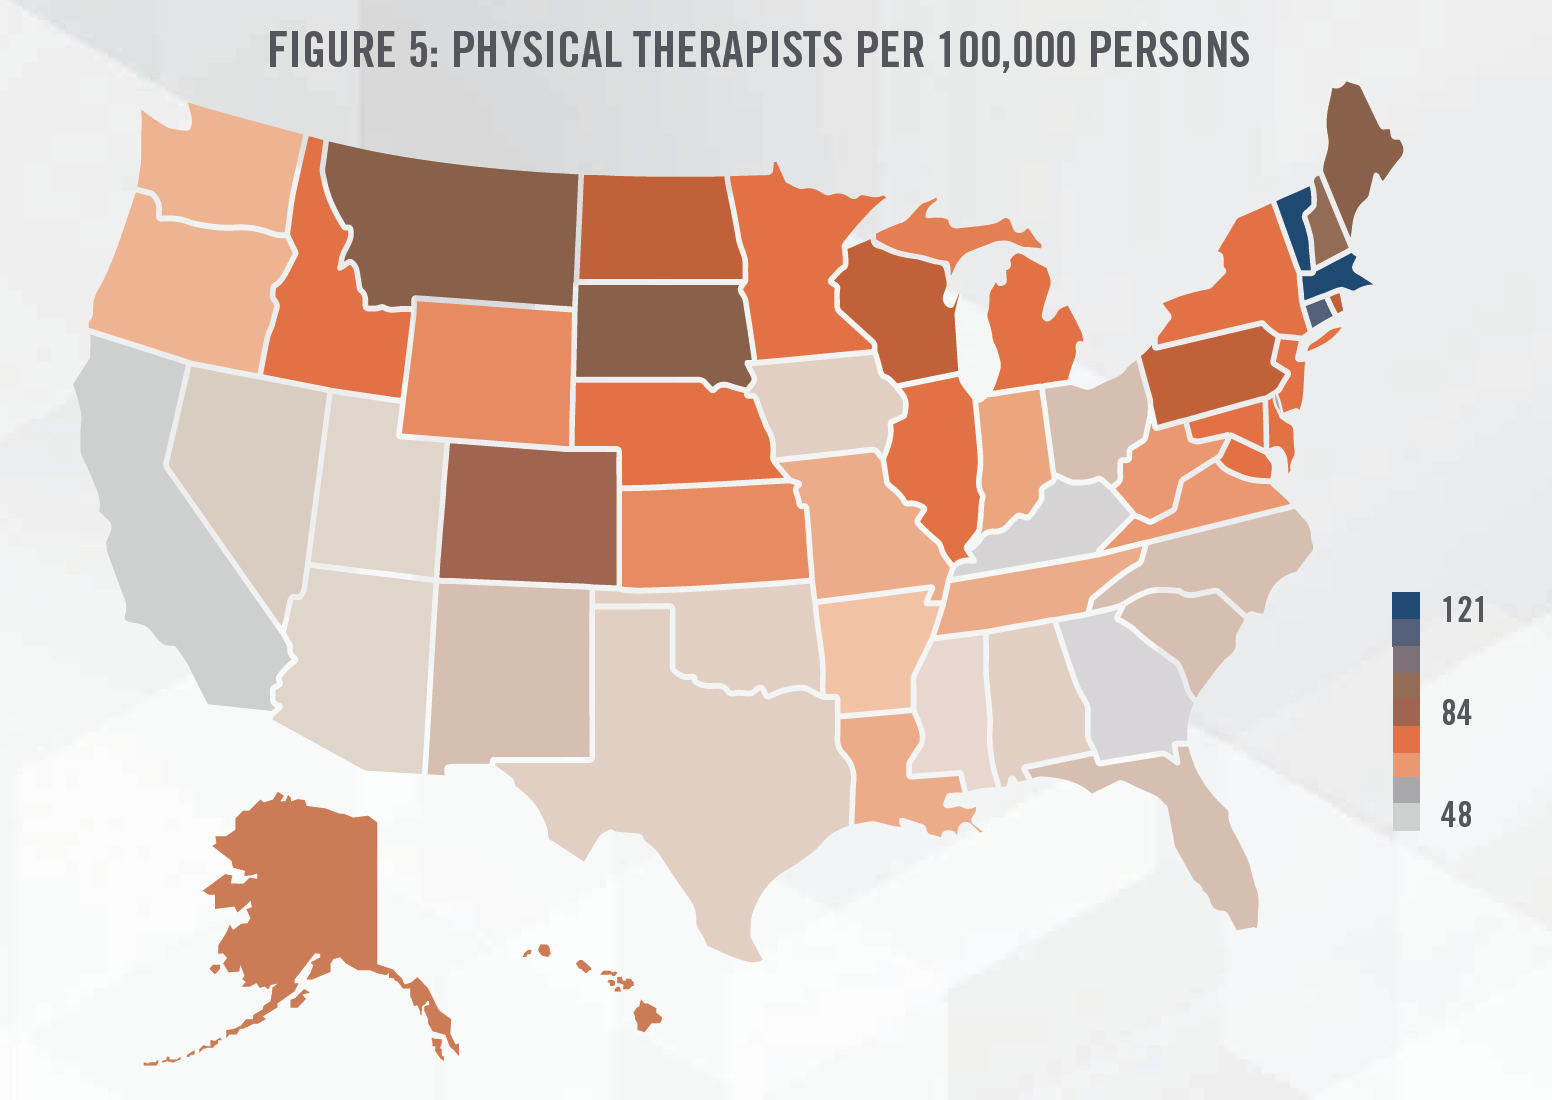
Currently, the supply of physical therapists in each state ranges from 48 to 121 PTs per 100,000 people with a median of 76 PTs, as further outlined in Figure 5.

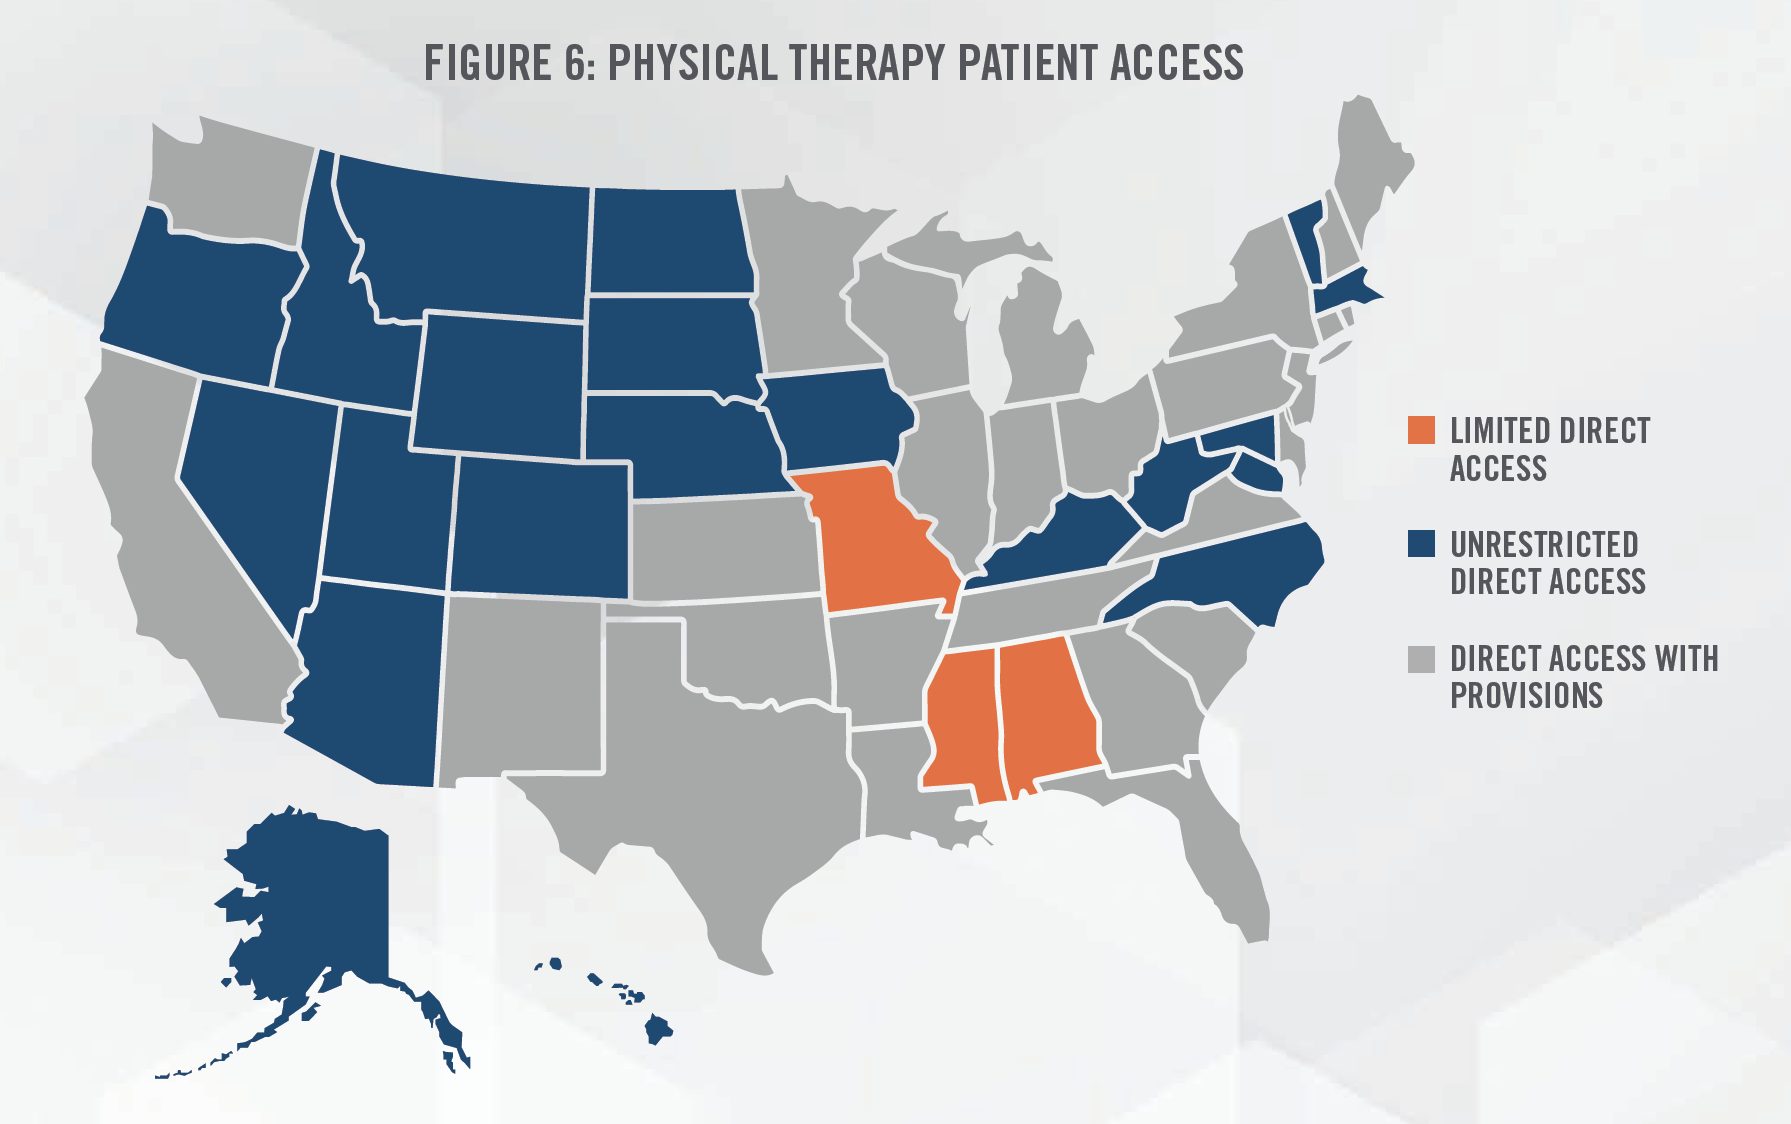
Studies have suggested that direct access to physical therapists is associated with lower costs and fewer patient visits. Historically, physicians have been a major source of patient referrals for physical therapy providers, with a survey from APTA indicating that only 50 percent of respondents reported some use of direct access. States with unrestricted direct access experience a higher use of direct access at 65.5 percent.[11]

![]()
![]()
![]()
![]()
![]()
![]()
![]()
![]()
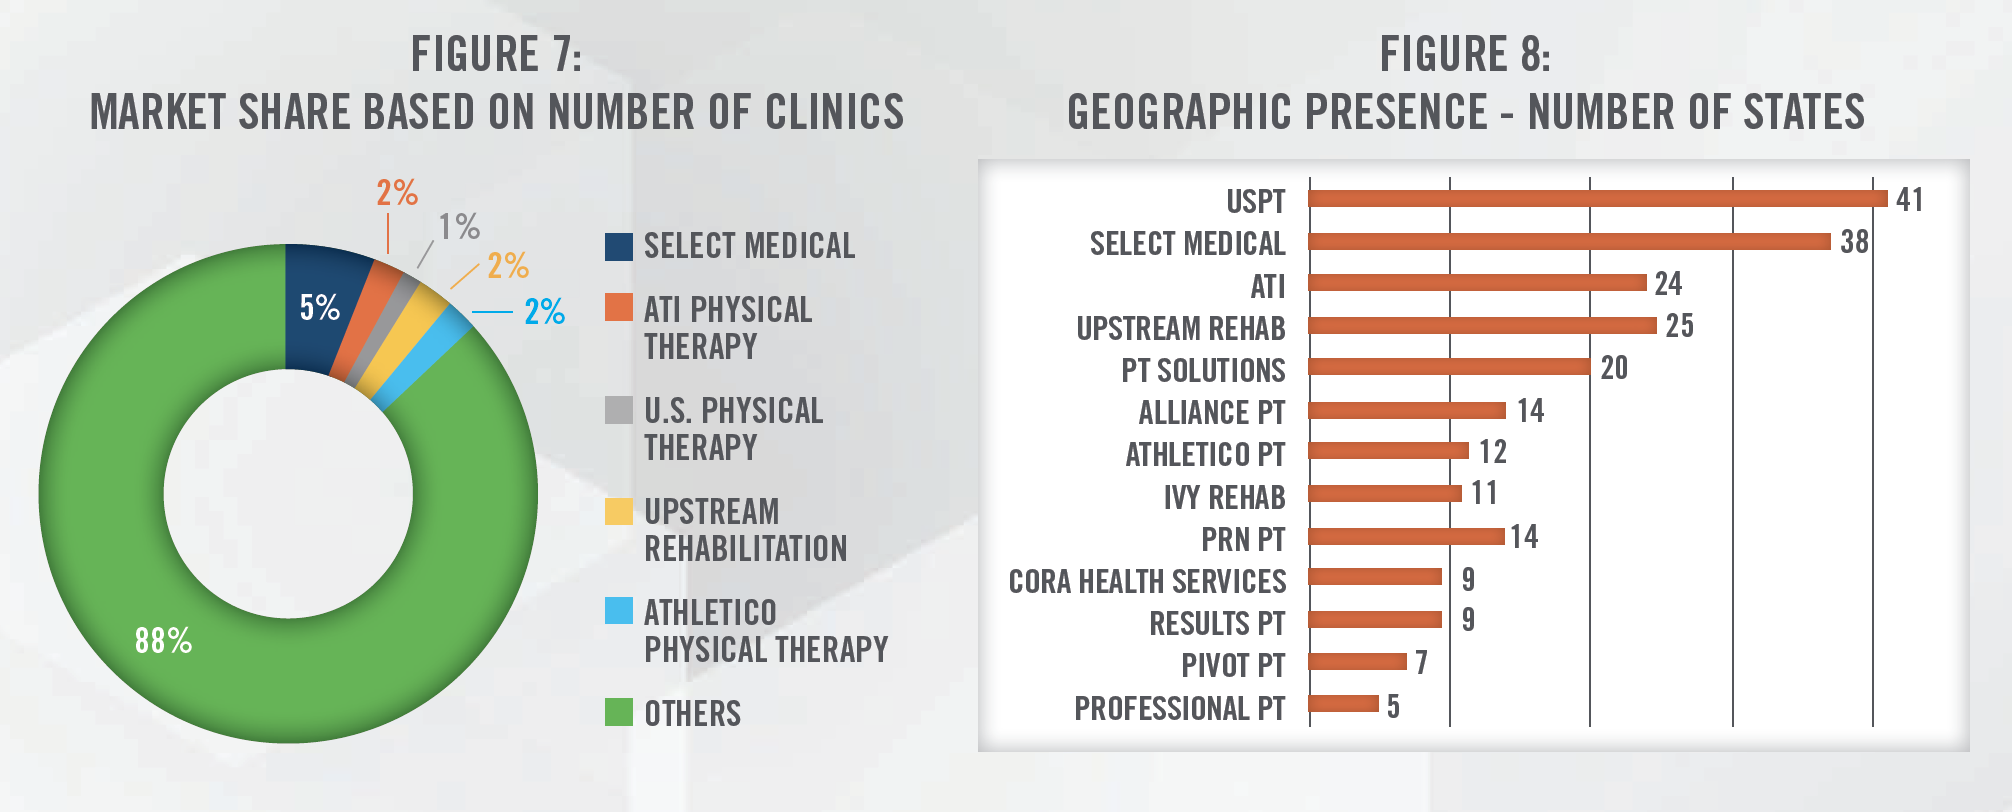
Physical therapy practices have many types of ownership structures, including private practice (i.e., owned by one or more therapist), private equity sponsored, hospital-owned, joint-venture, and publicly traded. Currently, there are over 38,000 physical therapy clinics in the United States.[12] While the market remains highly fragmented, with the largest operators controlling less than 10 percent of the market, there continues to be consolidation activity both among private equity sponsored platform companies and publicly traded companies that either specialize in outpatient physical therapy (e.g., U.S. Physical Therapy, NYSE:USPH and ATI Physical Therapy, Inc., NYSE: ATIP) or provide physical therapy as one of the many services (e.g., Select Medical Holdings, NYSE: SEM or IMAC Regeneration Centers, NASDAQ: IMAC). ATIP is in ongoing discussions with numerous targets that represent over 1,100 clinics across the country.[13] These companies have been expanding their geographic presence across multiple states in the U.S. (see Figure 8) in order to find additional add-on acquisition targets. Furthermore, organizations such as the Physical Therapy Compact Commission have made it easier for PTs and PTAs to work in multiple states without obtaining a new license.

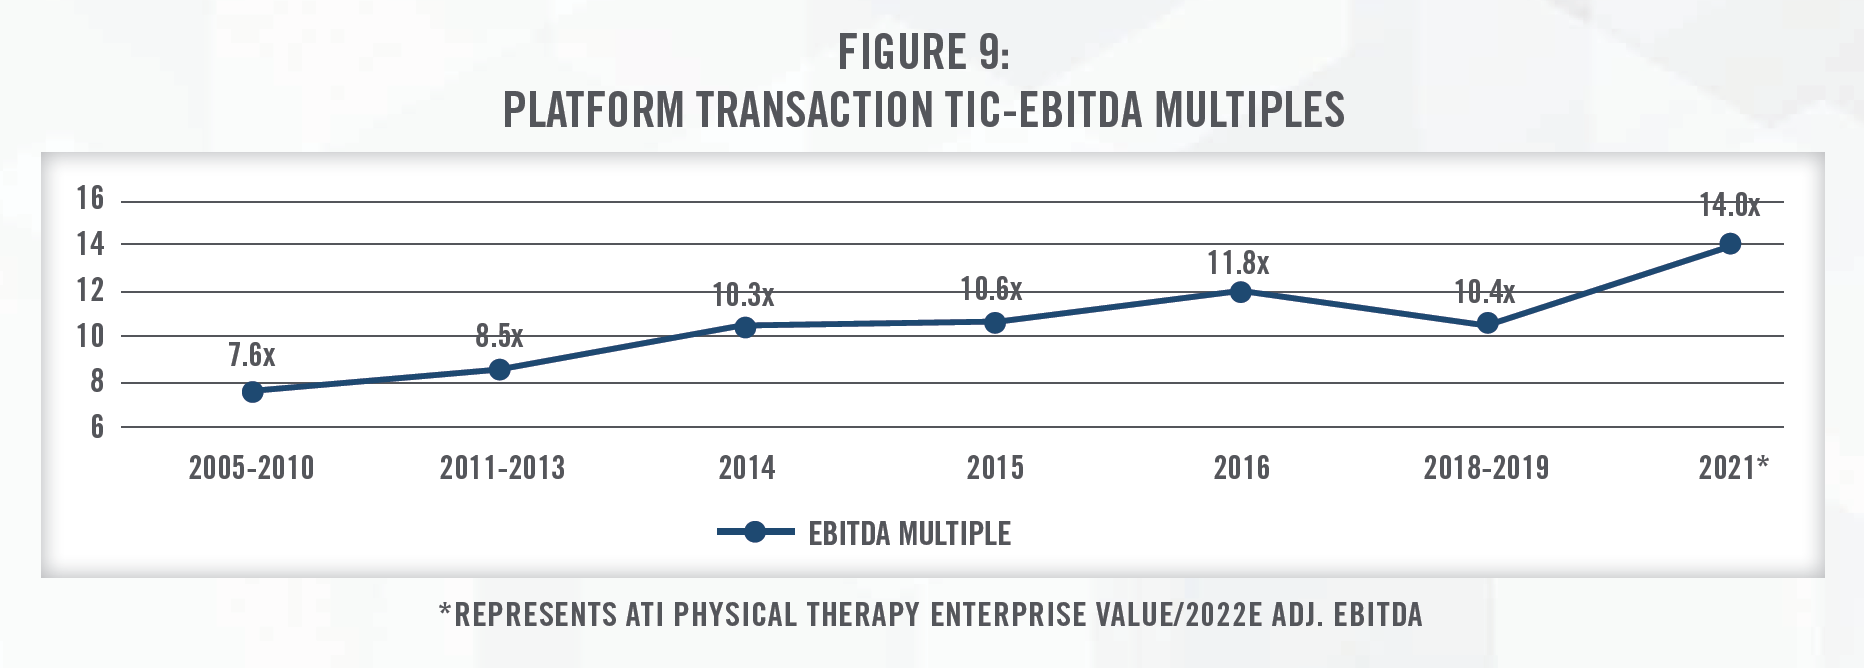
Two of the five largest physical therapy providers are sponsored by private equity groups, and there are at least 15 private equity sponsored physical therapy platform organizations acquiring and opening de novo practices in the United States.[14] This has resulted in an increase in valuation multiples for platform acquisitions from 7.6x EBITDA in late 2000s up to 14x EBITDA in 2021 (see Figure 9).[15]

![]()
![]()
![]()
![]()
![]()
![]()
![]()
![]()
The three most common valuation approaches – the Income, Market and Cost Approaches – can all be applied when valuing a physical therapy practice.
The Income Approach values businesses, interests in businesses, or assets by discounting the future economic benefits to present value using a risk-adjusted rate of return. In projecting out the future earnings for a business, it is important to understand how CMS’s final rule will impact revenue for the subject business. A practice that leverages more PTAs will see a larger impact to revenue than practices that do not utilize PTAs. Furthermore, it is important to account for a practice’s payor mix when projecting future changes in reimbursement as a cash-only practice will be much more protected from cuts in Medicare reimbursement.
The Market Approach provides an indication of value by drawing reference to prices paid in transactions involving similar companies (e.g., Comparative Transaction Method), or for shares in publicly-traded companies that provide similar services (i.e., Guideline Public Company Method) as the subject entity being valued. There have been an increasing number of transactions in the physical therapy sector in recent years that valuators can analyze, and these transactions provide context and an indication of the market multiples paid for transactions in the space.
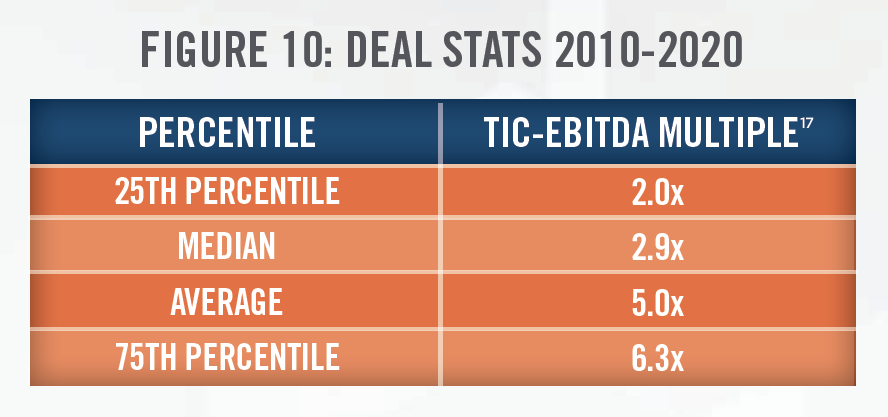

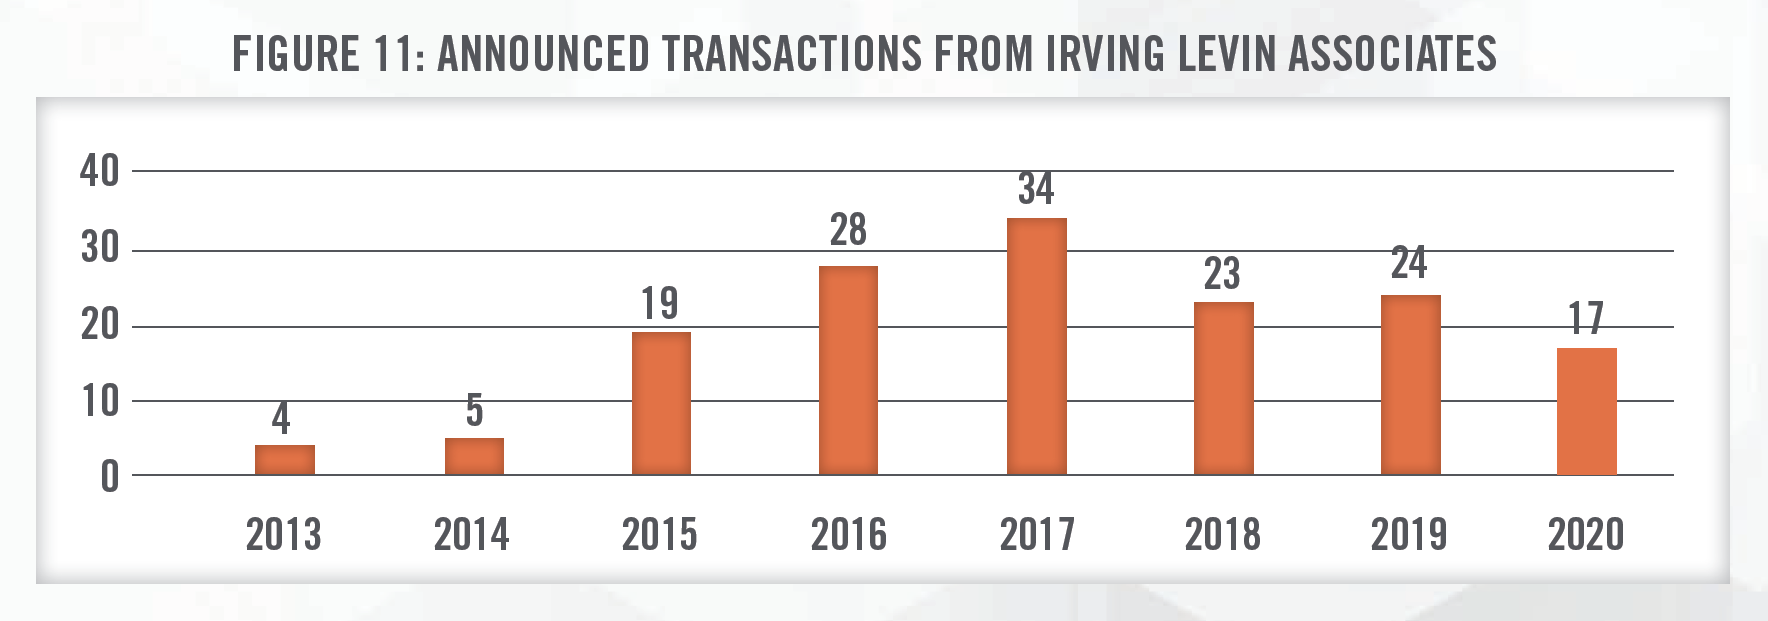
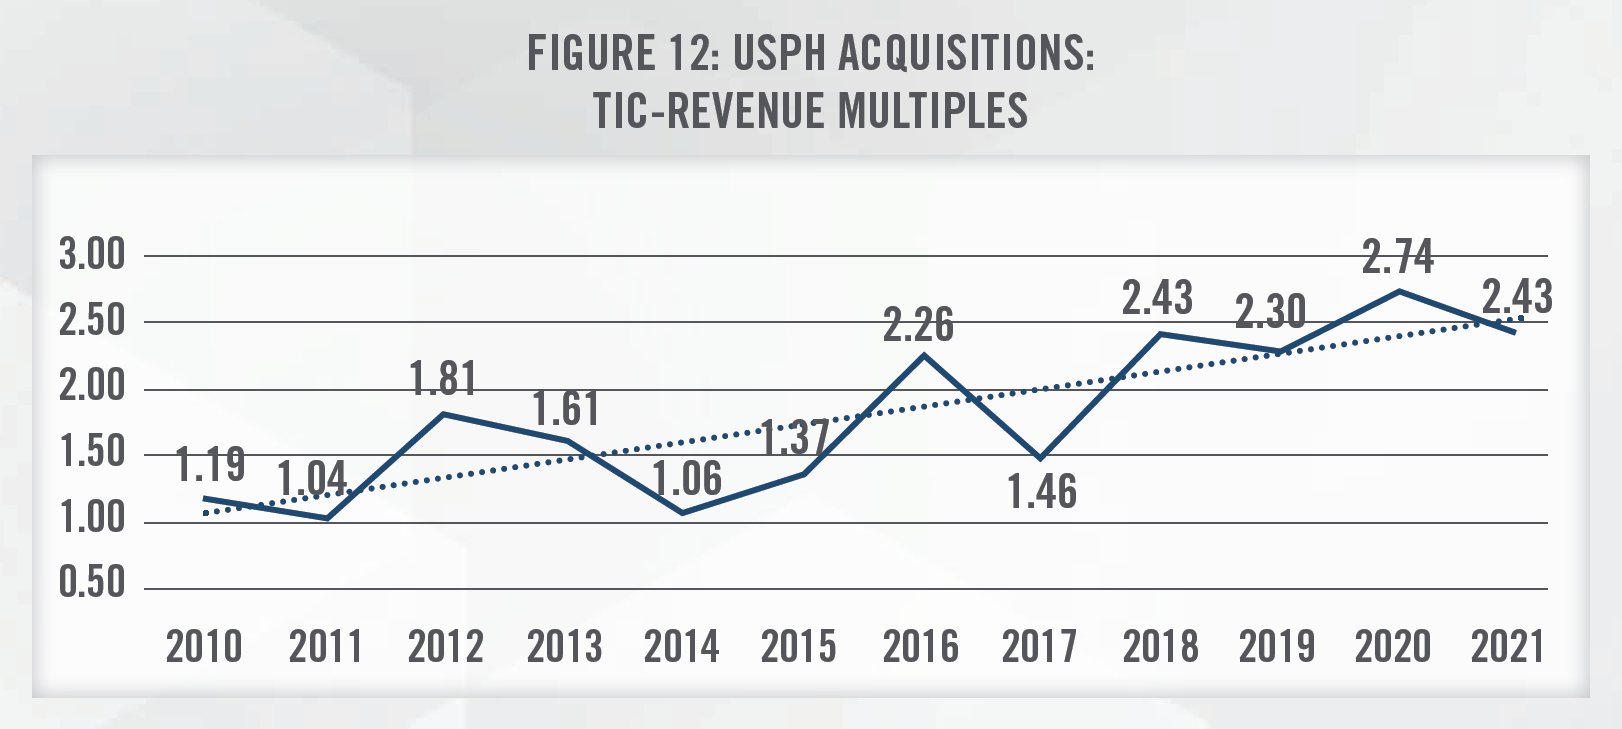
Figures 10 and 11 present the total invested capital (TIC)-to-EBITDA multiples for physical therapy transactions from 2010 through 2020, according to DealStats, as well as the number of outpatient physical therapy transactions each year, according to Irving Levin Associates.[16] As outlined in Figure 12, valuation multiples have generally been increasing as observed in recent acquisitions made by USPH over the last 10 years, due to many of the factors previously mentioned. USPH has generally completed one to five transactions each year over the last decade.


In applying the Guideline Public Company Method of the market approach, there are four publicly traded companies that provide outpatient physical therapy services that can be referenced, USPH, SEM, ATIP, and IMAC. It is important to consider that SEM and IMAC provides services in addition to outpatient physical therapy (e.g., long-term acute care, inpatient rehabilitation hospitals, cell therapy), so it may not be perfectly comparable to a subject entity being valued. In addition, the public companies benefit from economies of scale and geographic diversity that make them less risky investments than a physical therapy clinic focused on one geographic area. It is important for a valuator to consider the specific facts and circumstances surrounding the entity being valued and make adjustments to the multiples before applying them to a subject entity’s EBITDA.
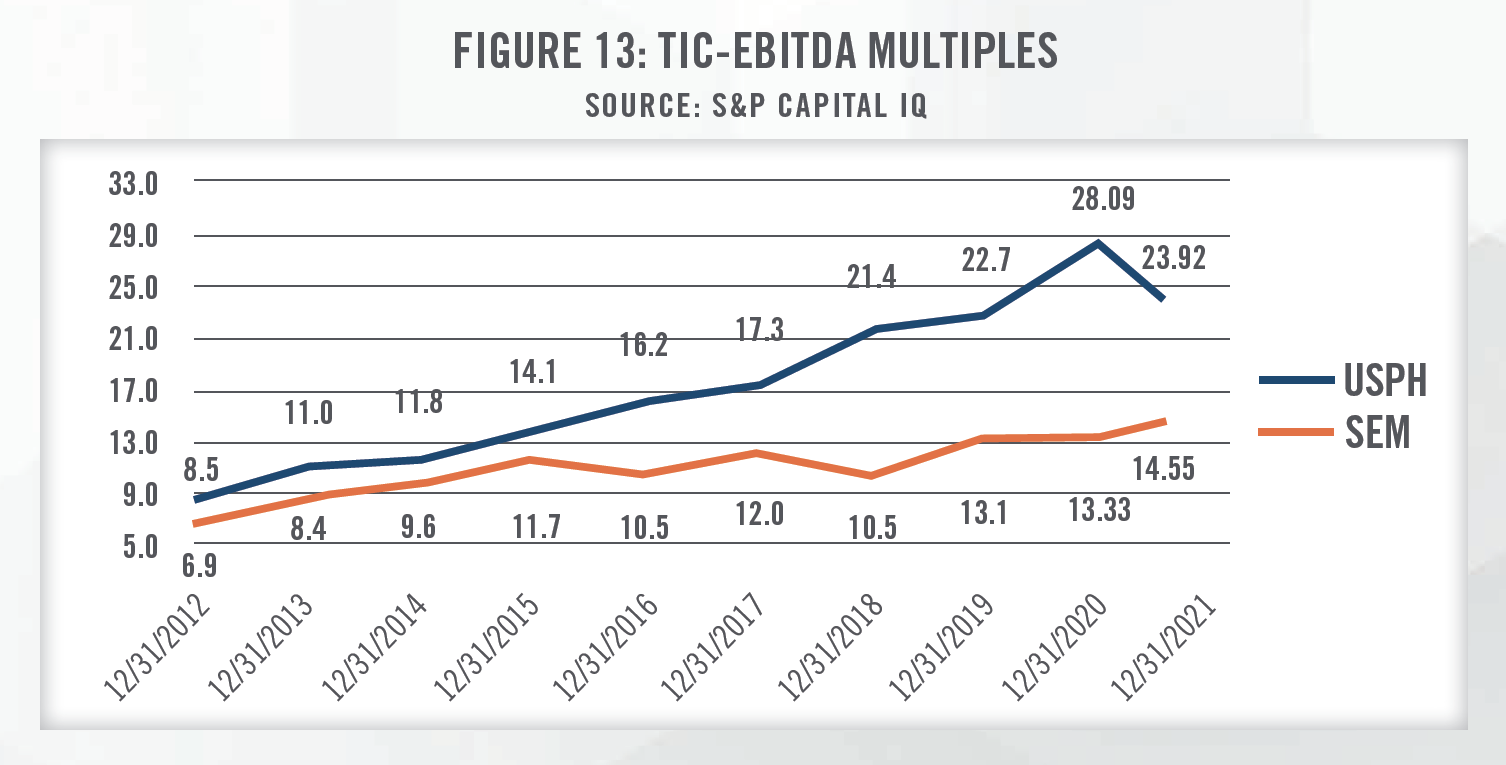
Figure 13 outlines the historical growth in trading multiples of USPH and SEM. Despite a brief decline in early 2020 due to the COVID-19 outbreak, the stock prices for USPH and SEM quickly recovered and continued to increase with the broader stock market. As the economy continues to re-open, companies may experience challenges in achieving their expected growth due to issues such as labor shortages. As stated by ATIP’s CEO Labeed Diab[18], “We are seeing growing demand for ATI’s services, and visit volume increased during the second quarter. However, the acceleration of attrition among our therapists in the second quarter and continuing into the third quarter, combined with the intensifying competition for clinicians in the labor market, prevented us from being able to meet the demand we have and increased our expectations for labor costs.” All else being equal, higher expenses result in lower earnings, thereby reducing the value of a business.

The final approach to consider when valuing a physical therapy practice is the Cost Approach, which provides an indication of value based on the cost to recreate the business or asset at today’s prices, less economic obsolescence. Given the nature of physical therapy practices, most businesses in the space do not have significant amounts of fixed assets, which are generally limited to equipment such as office equipment, exercise and fitness equipment, and treatment tables. However, there are a number of intangible assets that can be valued under the cost approach that may be appropriate for valuators to consider. One example is that businesses incur expenses associated with recruiting and hiring the workforce necessary to provide services. The existence of a turnkey operation represents an intangible asset for the buyer of a physical therapy practice. Additionally, a business’s trade name is a marketing-related intangible asset that derives its value from the benefits of brand recognition. Depending on the reputation of the business’s brand, it may have more leverage with payors or attract patients from a broader service area.
![]()
![]()
![]()
![]()
![]()
![]()
![]()
![]()
Merger and acquisition activity is expected to continue as the physical therapy industry remains highly fragmented. While there is uncertainty due to changes in reimbursement, demographic trends indicate a sustained growth in patients who will seek physical therapy services. With pressures to lower patient costs, insurers are also looking for high quality, low cost outpatient providers that may help prevent short-term disabilities from becoming chronic conditions or helping to speed recovery from surgery and musculoskeletal injuries. HealthCare Appraisers carefully watches new developments within the physical therapy industry and has the skills and experience required to render a valuation opinion for physical therapy practices in this ever-changing regulatory environment.
[1] IBISWorld – Physical Therapists in the US; June 2021
[2] The Medicare Payment Advisory Commission, Outpatient Therapy Services Payment System, last accessed on March 16, 2021 from : http://medpac.gov/docs/default-source/payment-basics/medpac_payment_basics_20_opt_final_sec.pdf?sfvrsn=0
[3] Centers for Medicare & Medicaid Services, Revisions to Payment Policies under the Medicare Physician Fee Schedule, Quality Payment Program and Other Revisions to Part B for CY 2020, last accessed on March 26, 2020 from: https://www.cms.gov/Medicare/Medicare-Fee-for-Service-Payment/PhysicianFeeSched/PFS-Federal-Regulation-Notices-Items/CMS-1715-F
[4] Ibid.
[5] Participants who score 85 points or more will also be eligible to receive an exceptional performance bonus, which will be, at minimum, an additional +0.5 percent adjustment, at minimum.
[6] CMS, Medicare Telemedicine Health Care Provider Fact Sheet, last accessed on March 26, 2020 from: https://www.cms.gov/newsroom/fact-sheets/medicare-telemedicine-health-care-provider-fact-sheet
[7] MedCityNews, “Virtual Physical Therapy Startup Hinge Health Reaches $3B Valuation,” last accessed April 22, 2021 from: https://medcitynews.com/2021/01/virtual-physical-therapy-startup-hinge-health-reaches-3b-valuation/
[8] Urban Institute, “The US Population is Aging”, last accessed on March 26, 2020 from: https://www.urban.org/policy-centers/cross-center-initiatives/program-retirement-policy/projects/data-warehouse/what-future-holds/us-population-aging#:~:text=
[9] Sun E, Moshfegh J, Rishel CA, Cook CE, Goode AP, George SZ. Association of Early Physical Therapy With Long-term Opioid Use Among Opioid-Naive Patients With Musculoskeletal Pain. JAMA Netw Open. 2018;1(8):e185909. doi:10.1001/jamanetworkopen.2018.5909
[10] Smith, B. A., Fields, C. J., & Fernandez, N. (2010). Physical therapists make accurate and appropriate discharge recommendations for patients who are acutely ill. Physical therapy, 90(5), 693–703. https://doi.org/10.2522/ptj.20090164
[11] APTA Report: Use of Direct Access Among PTs is Widespread, but Barriers Need to be Addressed, last accessed on March 26, 2020 from: https://www. apta.org/PTinMotion/News/2017/10/20/DirectAccessSurveyReport/
[12] U.S. Physical Therapy, Inc., Investor Presentation, as of March 4, 2020: https://www.usph.com/investor-relations/presentations/
[13] ATI Physician Therapy, Investor Presentation, February 2021: https://www.atipt.com/sites/default/files/ATI_FVACII_Investor_Deck_22_February_2021.
[14] Livingstone Partners, Physical Therapy: A Booming & Rapidly Evolving Sector, last accessed on March 26, 2020 from: https://media.livingstonepartners.com/wp-content/uploads/2016/09/30185924/Livingstone_Healthcare-Newsletter-Physical-Therapy_2016.pdf
[15] Ibid; Based on communication with Livingstone Partners, the higher valuation multiples observed in 2016 were a result of the nation’s largest physical therapy platforms being transacted. Subsequently, there were no platform deals in 2017 and the majority of platform deals in 2018 and 2019 were smaller, more risky transactions, which resulted in lower valuation multiples.
[16] Database does not contain every transaction.
[17] We have excluded outliers in calculating valuation multiples at each percentile.
[18] “ATI Physical Therapy Reports Second Quarter 2021 Results; Revises 2021 Forecast”, July 26, 2021, last accessed on September 8, 2021 from: https://investors.atipt.com/news/news-details/2021/ATI-Physical-Therapy-Reports-Second-Quarter-2021-Results-Revises-2021-Forecast/default.aspx
