Authors: Stephanie Tafoya and Luis A. Argueso

As discussed in a prior article, HAI examined the pitfalls of blindly relying on median benchmarks from compensation surveys. It is worth reiterating that numerous whistleblower complaints resulting in newsworthy settlements[1] illustrate that median benchmarks are not an automatic safe harbor for compensation that is both commercially reasonable and within FMV.
One should consider the following aspects of the survey data when selecting benchmarks:
Part One: What Lies Beneath Compensation Benchmarks based on Production
Part Two: The Ebb and Flow of Compensation Benchmarks
Part Three: A Tidal Wave of Common Misconceptions
PART TWO: THE EBB AND FLOW OF COMPENSATION BENCHMARKS
When reviewing survey data, it is common to observe that compensation benchmarks generally remain steady or increase slightly year-over-year. Occasionally, physician employment arrangements and professional services arrangements include annual percentage increases in compensation to account for cost-of-living adjustments. Although an annual increase in compensation may seem reasonable, due to the relatively high compensation values, the market for physician services does not behave like the market for other employees in the service industry. Oftentimes, compensation for physicians is tied to reimbursement for their services, meaning that material cuts in reimbursement by payors may result in decreases in compensation. These reimbursement reductions may occur because of Medicare policy, or as a result of consolidation in the insurance market. Generally, the greater the market share of a payor, the less a physician practice can afford to be out-of-network with that payor, resulting in reduced bargaining power on the part of the practice. As a result, inflationary compensation provisions may result in situations where the annual compensation paid to a physician is inconsistent with FMV.
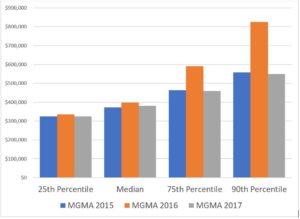
Separately, the changing dynamics of the surveyed population may result in drastic changes to compensation benchmarks reported by the surveys. For example, in the MGMA 2016[2] report, 51 medical groups submitted data for 211 intensivist physicians. In the MGMA 2017[3] report, the number of medical groups increased to 92, and the number of intensivist physicians increased to 403, nearly doubling the number of respondents over the prior year. With a large increase in respondent size, a change in the composition of the respondents can cause benchmarks to fluctuate. Figure 1 below shows the variance in the “Critical Care: Intensivist” compensation benchmarks as reported by MGMA.
Figure 1: Critical Care Compensation Variance

As presented in Figure 1, compensation values increased from 2015 to 2016, but there was a material decrease from 2016 to 2017 after the number of respondents nearly doubled. If one were to base 2017 compensation on the increase from 2015 to 2016, the resulting compensation amount would well exceed the corresponding benchmark reported in the 2017 survey. In addition, at the 75th and 90th percentiles, the compensation benchmarks decreased from 2015 to 2017. These observations highlight the importance of understanding the changes in survey demographics and consulting numerous sources of benchmark data.
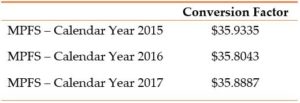
Given the observed variance of compensation benchmarks over time, some valuation experts consider basing compensation amounts on an average of benchmark compensation values from multiple years of the surveys. Unfortunately, this method also has its disadvantages and may be particularly problematic when using compensation benchmarks based on production. For example, the Center for Medicare and Medicaid Services (“CMS”) produces the Medicare Physician Fee Schedule (“MPFS”), which includes a complete list of Medicare fees and relative value units (“RVUs”) by HCPCS code.[4] Each year, an updated fee schedule is released and, in some instances, payment rates and/or work RVU values are adjusted from the prior year. The payment rates are calculated by taking the product of Medicare’s conversion factor and the RVU values (adjusted for various geographic factors).[5] As presented in Figure 2, the conversion factor is adjusted on an annual basis (note the decrease in the conversion factor from 2015 to 2016).
Figure 2: 2015-2017 MPFS Conversion Factors[6]

In addition to changes in the conversion factor, the MPFS also adjusts the RVU values assigned to the CPT codes. These adjustments create changes in production values reported by benchmark surveys. For example, in the final rule of the 2017 MPFS, gastroenterology, interventional radiology, neurosurgery, ophthalmology, and urology experienced decreases in the work RVUs of CPT codes used by these specialties, as presented in Figure 3. If reported production values such as work RVUs change, the reported compensation amounts per work RVU will likely change as well, creating unstable benchmarks.
Figure 3: MPFS Final Rule Impacts on Work RVUs[7]

FMV PITFALL: When selecting appropriate compensation values for physician compensation arrangements, simply relying on one piece of data or blindly averaging data from multiple years, may potentially lead to inappropriate compensation values. It is important to be wary of external factors influencing physician compensation, as well as changes in the underlying survey data, in order to avoid selecting compensation values that are inconsistent with fair market value. HealthCare Appraisers, Inc. is available to help navigate the dangerous waters surrounding the fair market value of physician compensation arrangements.
[1] Carr, J. Milliron, M. and Huztler, C; Is Median Compensation in the Crosshairs? Hospitals & Health Systems Rx American Health Lawyers Association (May 16, 2016)
[2] Source: MGMA DataDive Provider Compensation 2016. Used with permission from MGMA, 104 Inverness Terrace East, Englewood, Colorado 80112. 877.275.6462. www.mgma.com. Copyright 2016. Please visit the MGMA “Data Insights” page, available at: https://www.mgma.com/data, to learn more about MGMA DataDive®.
[3] Source: MGMA DataDive Provider Compensation 2017. Used with permission from MGMA, 104 Inverness Terrace East, Englewood, Colorado 80112. 877.275.6462. www.mgma.com. Copyright 2017. Please visit the MGMA “Data Insights” page, available at: https://www.mgma.com/data, to learn more about MGMA DataDive®.
[4] The Healthcare Common Procedure Coding System (“HCPCS”) is used to assign a code to various products, supplies, and services which are rendered by a healthcare provider to a patient. Level I of the HCPCS is comprised of the Current Procedural Terminology (“CPT”) codes, which largely identify services and procedures furnished by physicians (and other healthcare professionals).
[5] For more information regarding the calculation of payment rates, refer to the Medicare Payment Advisory Commission’s Medicare Payment Basics document for the MPFS, accessible at: http://medpac.gov/-documents-/payment-basics/page/2
[6] As reported in (i) Federal Register / Vol. 80, No. 54 / Tuesday, March 20, 2015 / Rules and Regulations; (ii) Federal Register / Vol. 81, No. 45 / Tuesday, March 8, 2016 / Rules and Regulations; and (iii) Federal Register / Vol. 81, No. 220 / Tuesday, November 15, 2016 / Rules and Regulations
[7] Ibid.
