Authors: Stephanie Tafoya and Luis A. Argueso

As discussed in parts one and two, both of which are hyperlinked below, median benchmarks are not an automatic safe harbor for establishing compensation that is consistent with FMV. It is important to understand the underlying survey data in order to keep a compensation arrangement from walking the plank. In Part Three, learn about common misconceptions and hidden risks that may cause an arrangement to go overboard.
One should consider the following aspects of the survey data when selecting benchmarks:
Part One: What Lies Beneath Compensation Benchmarks based on Production
Part Two: The Ebb and Flow of Compensation Benchmarks
Part Three: A Tidal Wave of Common Misconceptions
The selection of appropriate provider compensation contract terms can be as unwieldy as a ship in a storm, especially when all parties must come to an agreement on said terms. Seemingly conservative provider contract terms can contain hidden risks that may result in a compliance nightmare.
One common misconception: the more specific the local market data, the better. Although some compensation surveys report regional, or even state-level data, limited data exists on a local level.[1] Both regional and state-level data can provide limited insight into a specific marketplace given the high levels of compensation variability that can exist within regions and even states (e.g., contrast San Francisco with Palm Desert in California). Thus, it is appropriate to evaluate the specific market factors that may drive compensation to avoid a trickle of data points leading to a flood of bad calculations.
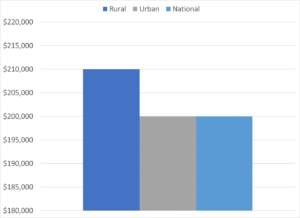
A city’s cost-of-living may play a primary role in compensation, though caution is warranted given the relatively high compensation amounts earned by physicians (i.e., compensation may not scale linearly with cost-of-living at higher income brackets). A large metropolitan area with a high cost of living may command higher compensation values, but in comparison to what? In comparison to smaller, adjacent metropolitan areas in the region? Most likely. In comparison to rural areas in the same region? Maybe not. As illustrated in Figure 1, on average physicians in rural areas earn slightly higher compensation than physicians in metropolitan areas. The variance may be due to the low supply of doctors living in the rural location, and the low supply willing to relocate.[2] This rural premium exists in spite of the relatively lower cost-of-living typically found in rural communities. Furthermore, the median compensation for a large urban location is consistent with the median compensation at a national level, the latter of which does not consider population size). Therefore, high cost-of-living does not automatically imply a treasure chest of compensation consistently above the median benchmarks.
Figure 1: Primary Care[3] Median Compensation – Rural vs Urban vs. National[4]
Unfortunately, a diligent analysis does not end once a reasonable compensation benchmark is selected. This leads to the second misconception: compensation terms that are independently consistent with FMV and commercially reasonable, may no longer be so when considered in aggregate. As mentioned in Part One, within many benchmark surveys, total cash compensation data reported includes not only compensation for professional services, but may also include compensation received for quality incentives, call coverage, advanced practice provider (“APP”) supervision, etc. Therefore, base salary amounts are not the only compensation term that needs attention when building a compensation package. Base compensation, once coupled with additional payments, may give rise to “stacking” concerns. Stacking refers to the practice of layering multiple compensation provisions into a single compensation arrangement, which may result in a total payment amount that exceeds FMV.[5]
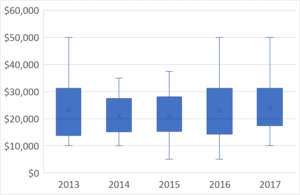
Consider, for example, sign-on bonuses. Although typically considered as additive to annual salary, many compensation surveys include bonus payments in their reported annual compensation amounts.[6] Furthermore, avoid blindly assuming that sign-on bonuses should increase steadily like a rising tide year-over-year. As shown in Figure 2, median sign-on bonuses for all physician specialties are not only close in range but have remained relatively unchanged over a 5-year period.
Figure 2: Median Sign on Bonuses, All Specialties – 5-year Trend[7]
When finalizing agreement terms, don’t just focus on the dollar signs. A third common misconception is that total aggregate compensation is the sole determinant of FMV for compensation arrangements. Other terms, such as hours worked and vacation time, are equally important. Why would these metrics be a FMV concern?
An example is illustrative. Consider the following compensation terms: (i) 7 shifts of on-call coverage per month (i.e., up to 2,016 hours per year assuming a shift length of 24-hours); (ii) administrative services amounting to an additional 20 hours per month (i.e., 240 hours per year); (iii) another 10 hours per month for APP supervision services (i.e., 120 hours per year); and 40 hours per week of clinical coverage (i.e., 1,880 hours per year, assuming 47 weeks worked). The terms in this example add up to 4,256 worked hours per year. Benchmark hours per year reported by MGMA[8] range up to 4,130 at the 90th percentile. In this example, it is reasonable to ask: “How is the physician working over 4,130 hours per year?” This question requires consideration of both FMV (e.g., are there periods of double-payment where the physician can provider multiple services simultaneously) and commercial reasonableness (e.g., can these duties reasonably be accomplished by a single individual).
Additionally, compensation packages may include terms stating that unused vacation time will be paid out to the physician at the end of the year. If the physician in question has 12-weeks of vacation and is already being paid at the FMV ceiling, the resulting compensation at the end of the year may be outside of FMV. In summary, many leaky compensation terms can quickly capsize seemingly ironclad compensation arrangements.
FMV PITFALL: Negotiating a compensation package comes with hidden risks lurking beneath. It is important to understand market factors and analyze compensation arrangements holistically in order to avoid selecting compensation values that are inconsistent with fair market value. HealthCare Appraisers, Inc. is available to help navigate the dangerous waters surrounding the fair market value of physician compensation arrangements.
[1] Further, the existing local-level data, such as the data reported by the U.S. Bureau of Labor Statistics (“BLS”) in the Occupational Employment Statistics survey, is typically based on specialty aggregations given the limited number of physicians relative to employee counts for other occupations. Addressing the limitations of these aggregations for physicians has been a recent goal for the BLS. In its 2018 revision to the Standard Occupational Classification system (i.e., the system used by the BLS to define the occupations for which it reports data), the BLS added 8 new physician specialties. For more information, consult: https://www.bls.gov/soc/2018/soc_2018_whats_new.pdf
[2] Further supporting this observation, the Centers for Medicare and Medicaid Services (“CMS”) offers a 10% bonus payment to healthcare providers, based on the allowable reimbursement amount from the Physician Fee Schedule, for services furnished to Medicare beneficiaries in geographic Health Professional Shortage Areas. For more information, consult: https://www.cms.gov/Outreach-and-Education/Medicare-Learning-Network-MLN/MLNProducts/Downloads/HPSAfctsht.pdf
[3] Primary care data includes the following MGMA specialties: family medicine (with OB), family medicine (without OB), family medicine: ambulatory only, family medicine: sports medicine, family medicine: urgent care, geriatrics, hospice/palliative care, hospitalist: family medicine, hospitalist: internal medicine, internal medicine: general, internal medicine: ambulatory only, OB/GYN: general, OB/GYN: gynecology (only), pediatrics: general pediatrics: adolescent medicine, pediatrics: hospitalist, pediatrics: hospitalist – internal medicine, pediatrics: internal medicine, pediatrics: sports medicine, pediatrics: urgent care, urgent care.
[4] Rural data is for a population size of 2,500 – 19,000. Urban data is for a population size of 1 million or more. Source: MGMA DataDive Provider Compensation 2017. Used with permission from MGMA, 104 Inverness Terrace East, Englewood, Colorado 80112. 877.275.6462. www.mgma.com. Copyright 2018. Please visit the MGMA “Data Insights” page, available at: https://www.mgma.com/data, to learn more about MGMA DataDive®.
[5] See how the Office of Inspector General “OIG” views stacking risks in the OIG Advisory Opinion 12-15 (specifically, page 7): https://oig.hhs.gov/fraud/docs/advisoryopinions/2012/AdvOpn12-15.pdf
[6] For example, MGMA’s definition of total cash compensation includes: provider wages, bonus and/or incentive payments, research stipends,honoraria, and distribution of profits.
[7] The shaded boxes represent the values ranging from the 25th to the 75th percentile, and the “x” within each box represents the median value. The outer most lines represent the minimum and maximum reported values. MGMA DataDive Provider Compensation 2017. Used with permission from MGMA, 104 Inverness Terrace East, Englewood, Colorado 80112. 877.275.6462. www.mgma.com. Copyright 2018. Please visit the MGMA “Data Insights” page, available at: https://www.mgma.com/data, to learn more about MGMA DataDive®.
[8] MGMA DataDive Provider Compensation 2017. Used with permission from MGMA, 104 Inverness Terrace East, Englewood, Colorado 80112. 877.275.6462. www.mgma.com. Copyright 2018. Please visit the MGMA “Data Insights” page, available at: https://www.mgma.com/data, to learn more about MGMA DataDive®.